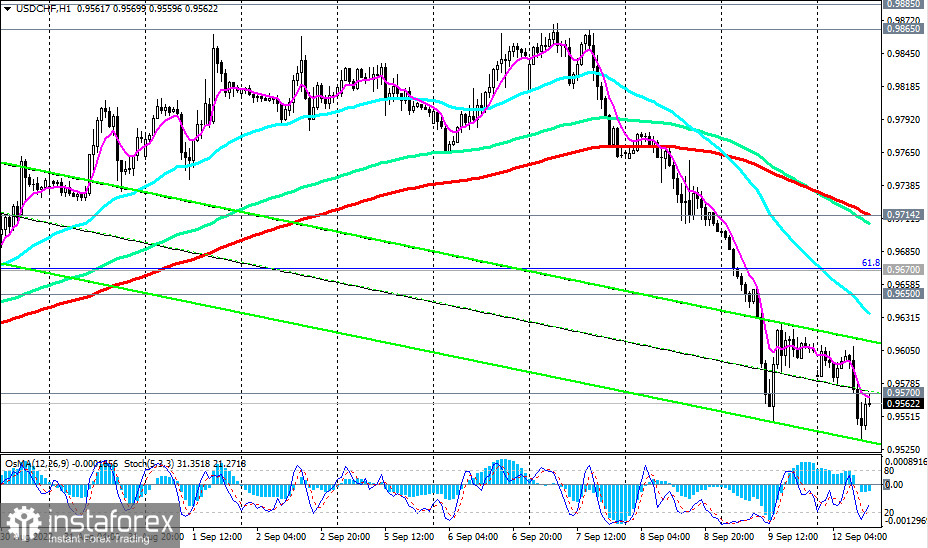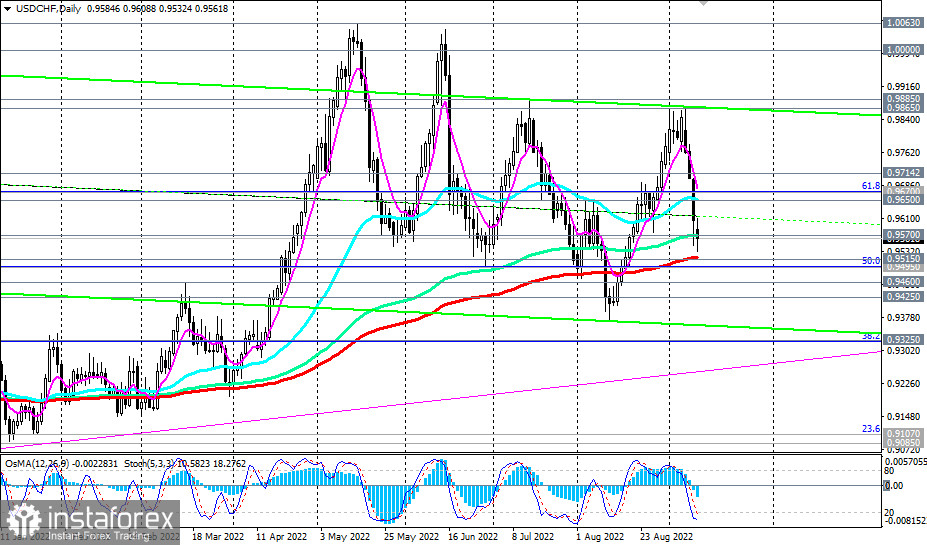
The USD/CHF pair, as of this writing, is trading near 0.9560, being in the zone of key support levels 0.9570 (144 EMA on the daily chart), 0.9515 (200 EMA on the daily chart), the breakdown of which may pose a threat to the bullish trend of the pair.
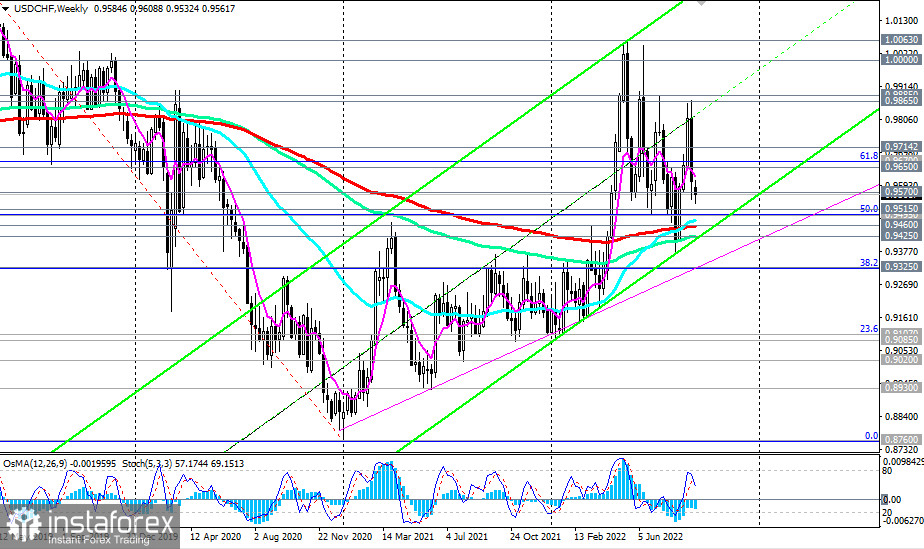
In general, the long-term positive dynamics of USD/CHF remains. Therefore, the current decline can be considered as a correction and an opportunity to enter long positions (of course, we should not forget about protective stops).

A breakout of today's local high at 0.9608 may be the first signal for resuming purchases, and a breakout of resistance levels 0.9650 (50 EMA on the daily chart), 0.9714 (200 EMA on the 1-hour chart) will be the confirmation.
In an alternative scenario, the price will break through the support levels of 0.9515 and 0.9495 (50% Fibonacci retracement of the upward correction to the downward wave that began in April 2019 near 1.0235), and USD/CHF will head towards the key support levels of 0.9460 (200 EMA on the weekly chart), 0.9425 (144 EMA and the lower line of the ascending channel on the weekly chart), separating the long-term bullish trend of the pair from the bearish one.

Support levels: 0.9515, 0.9495, 0.9460, 0.9425
Resistance levels: 0.9570, 0.9600, 0.9650, 0.9670, 0.9714
Trading Tips
Sell Stop 0.9530. Stop-Loss 0.9610. Take-Profit 0.9515, 0.9495, 0.9460, 0.9425, 0.9400
Buy Stop 0.9610. Stop-Loss 0.9530. Take-Profit 0.9650, 0.9670, 0.9714, 0.9865, 0.9885, 0.9900, 0.9970, 1.0000, 1.0060
 English
 Русский
 Bahasa Indonesia
 Bahasa Malay
 ไทย
ไทย Español
 Deutsch
 Български
 Français
 Tiếng Việt
 中文
中文 বাংলা
বাংলা हिन्दी
 Čeština
 Українська
 Română

