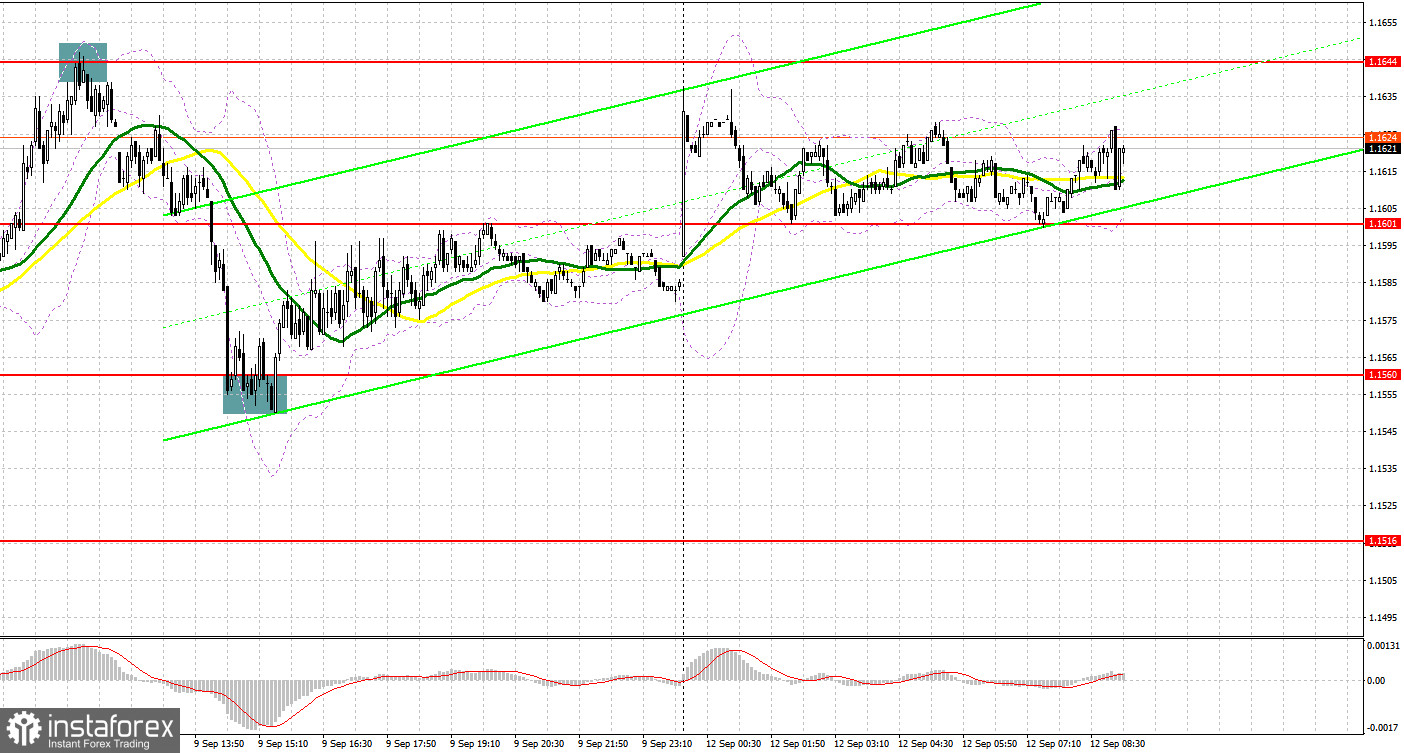
Two great entry signals were formed on Friday. Let's have a look at the 5-minute chart to see what happened there. In my morning review, I outlined the level of 1.1644 as a good point for entering the market. After a breakout of the 1.16 area and a subsequent rise, bulls managed to push the price up to the high of 1.1644. A false breakout at this point created a good opportunity to open short positions. As a result, the pair slumped by more than 80 pips. Bulls managed to bring the price back above 1.1560 only in the afternoon by forming a false breakout and a buy signal. The upside correction was about 40 pips.

For long positions on GBP/USD:
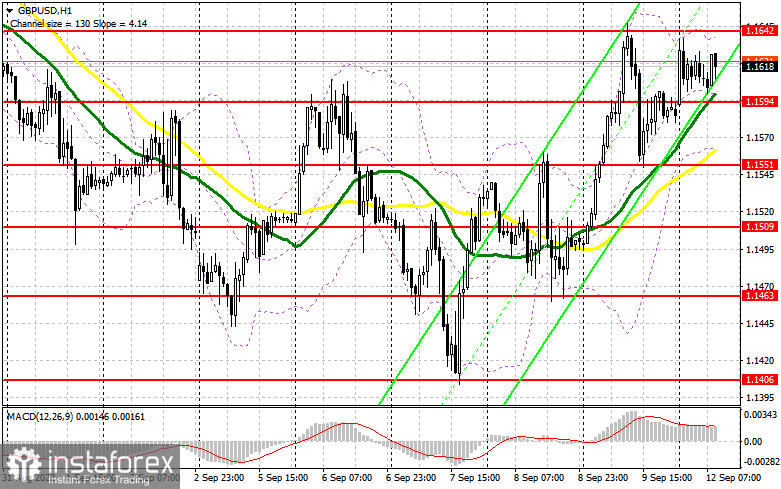
Markets have already received a rather discouraging bunch of macroeconomic data from the UK. However, lower GDP and other weak indicators did not stop traders from buying the pair as they are betting on further rise of the pound. This is why I recommend focusing on the nearest resistance at 1.1642 which was formed last Friday. A decline in GBP/USD in the first half of the day would be great to open new long positions. But only a false breakout at 1.1594 will generate the first buy signal with the next upward target seen at 1.1642. A break and a downside test of this level may trigger stop-loss orders set by speculative sellers which will form another buy signal towards the next upper target at 1.1690. The level of 1.1745 will serve as the most distant target where I recommend profit taking. If GBP/USD depreciates and buyers are idle at 1.1594, the pair will come under pressure but there is no need to panic. If so, I would advise you to buy the pair only when the price reaches the next support of 1.1551. This is where moving averages are found that are playing on the side of the bulls. In case of a rebound in GBP/USD, open long positions from the level of 1.1509, or even lower from 1.1463, bearing in mind an intraday correction of 30-35 pips.
For short positions on GBP/USD:
On Friday, bears did their best to protect the key levels. However, they were close to failure today when the pair initiated a sharp rise in the Asian session. The level of 1.1642 is viewed as the key one, so I suggest focusing on this mark. The best moment to open short positions on GBP/USD will be a false breakout at this range together with a divergence formed by the MACD indicator. It can potentially limit the further rise of the pair. This may also generate a sell signal and a reversal towards 1.1594 which serves as interim support that was formed on Monday morning. To seize the initiative, bears will need to break through this range and retest it, thus creating a new entry point to sell the pair with the target at 1.1551. The level of 1.1509 will act as the most distant target where I recommend profit taking. If GBP/USD rises and bears are idle at 1.1642, the pond may develop a strong upside movement, and sellers may lose ground. This will validate the continuation of the upside correction in the pound. A false breakout at the next resistance of 1.1690 will create an entry point into short positions, considering a slight possible decline in the quote. If nothing happens there as well, I would advise you to sell GBP/USD right after a rebound from 1.1754, bearing in mind another downside pullback of 30-35 pips within the day.

COT report:
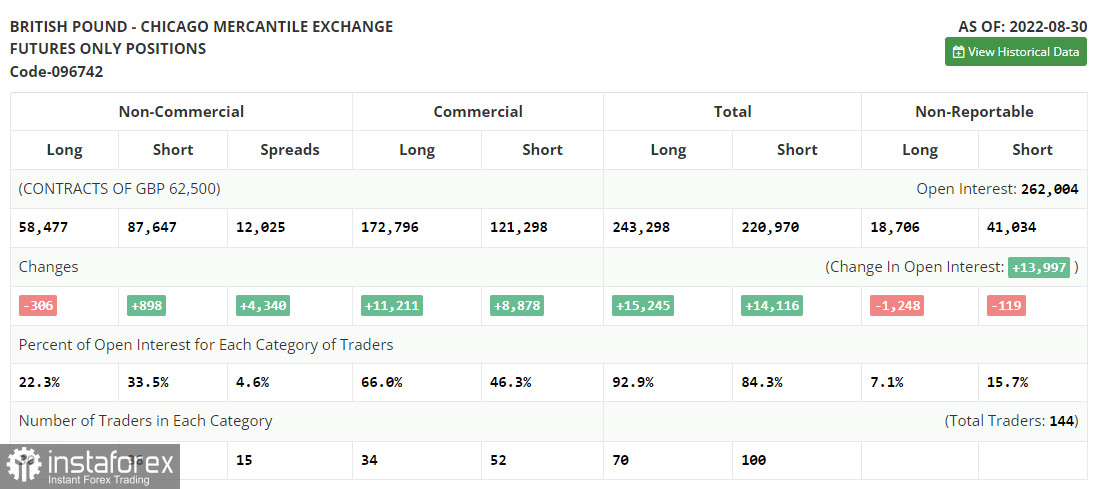
The Commitment of Traders report for August 30 showed a rise in short positions and a drop in the long ones. This confirms once again that the pound is going through a steep fall. The pair will stay under strong pressure in the near term as the UK's economy is struggling and GDP is contracting at a fast pace. The election of the new Prime Minister will provide only a short-term support for the pound as the overall situation is unlikely to change dramatically. Meanwhile, the US economy keeps demonstrating its resilience. For example, the recent jobs data confirmed the Fed's intention to pursue its tight monetary policy at a rapid pace. This, in turn, will increase the pressure on the British pound that is already suffering from other negative factors. Expectations of higher inflation and the worsening cost of living crisis in the UK stop traders from going long on the pound. If the upcoming macroeconomic data turns out to be disappointing, the pound may drop down below the current levels. According to the latest COT report, long positions of the non-commercial group of trades decreased by 306 to 58,477, while short positions rose by 898 to 86,647. As a result, the net non-commercial position increased to -29 170 from -27 966. The weekly closing price dropped to 1.1661 from 1.1822.

Indicator signals:
Moving Averages:
Trading above the 30- and 50-day moving averages indicates an upside correction in the pair.
Please note that the time period and levels of the moving averages are analyzed only for the H1 chart, which differs from the general definition of the classic daily moving averages on the D1 chart.
Bollinger Bands:
In case of a decline, the lower band of the indicator at 1.1551 will act as support. If the pair advances, the upper band of the indicator at 1.1642 will serve as resistance.
Description of indicators:
• A moving average of a 50-day period determines the current trend by smoothing volatility and noise; marked in yellow on the chart;
• A moving average of a 30-day period determines the current trend by smoothing volatility and noise; marked in green on the chart;
• MACD Indicator (Moving Average Convergence/Divergence) Fast EMA with a 12-day period; Slow EMA with a 26-day period. SMA with a 9-day period;
• Bollinger Bands: 20-day period;
• Non-commercial traders are speculators such as individual traders, hedge funds, and large institutions who use the futures market for speculative purposes and meet certain requirements;
• Long non-commercial positions represent the total number of long positions opened by non-commercial traders;
• Short non-commercial positions represent the total number of short positions opened by non-commercial traders;
• The total non-commercial net position is the difference between short and long positions of non-commercial traders.
 English
 Русский
 Bahasa Indonesia
 Bahasa Malay
 ไทย
ไทย Español
 Deutsch
 Български
 Français
 Tiếng Việt
 中文
中文 বাংলা
বাংলা हिन्दी
 Čeština
 Українська
 Română

