English
  Русский
 Bahasa Indonesia
 Bahasa Malay
 ไทย
ไทย Español
 Deutsch
 Български
 Français
 Tiếng Việt
 中文
中文 বাংলা
বাংলা हिन्दी
 Čeština
 Українська
 Română

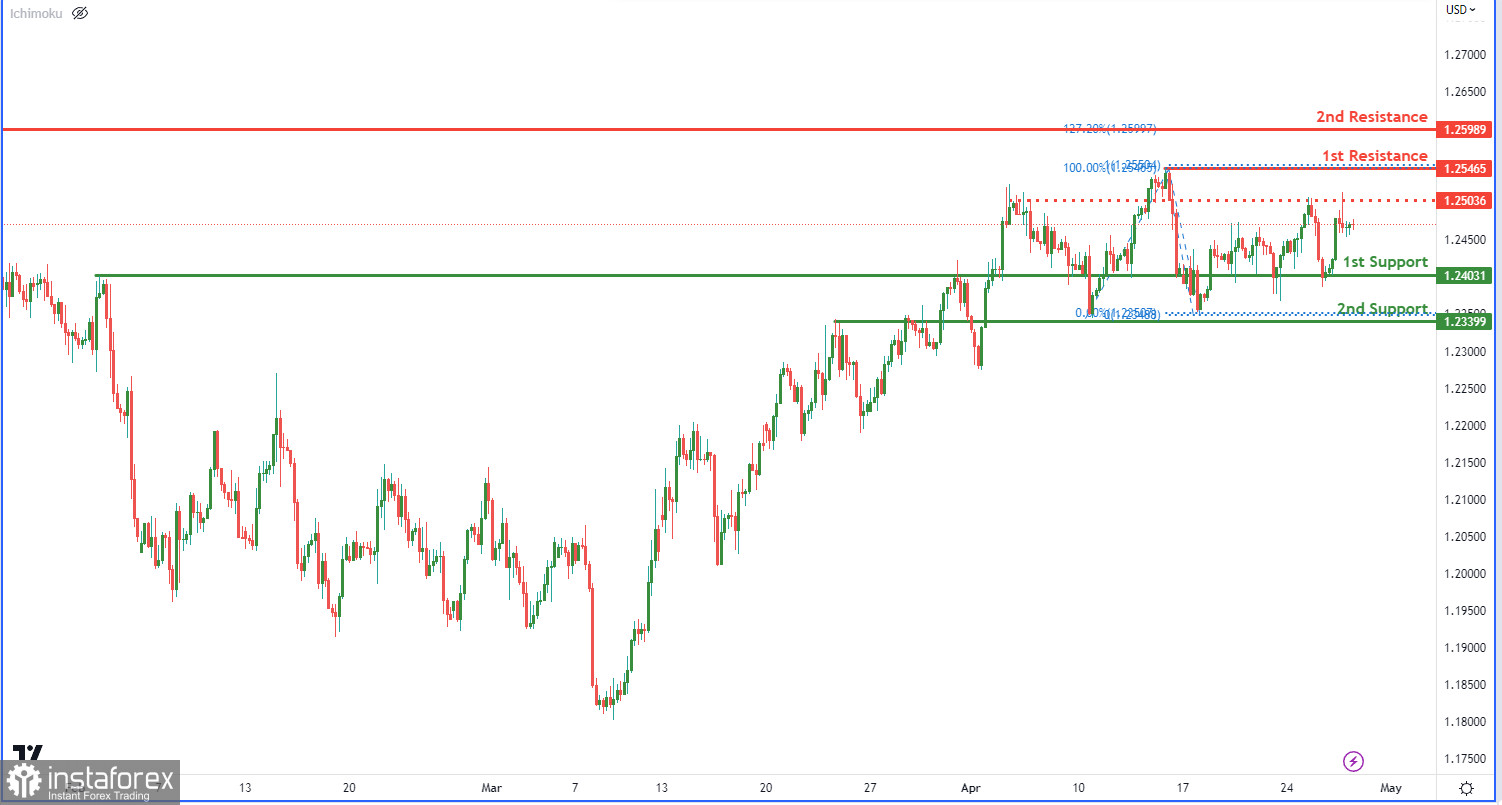
The GBP/USD chart currently displays a bullish momentum, indicating the potential for a continued rise towards the first resistance level. The first support level, located at 1.2403, is an overlap support that has shown resilience over multiple past tests. Similarly, the second support level at 1.2339 is also an overlap support and reflects a significant level of historical support.
A swing high resistance at 1.2546 marks the first resistance level, accompanied by a 100% Fibonacci projection. A successful breach of this resistance could propel the price towards the second resistance level at 1.2598, which is also a swing high resistance and coincides with a 127.20% Fibonacci extension.
Between these two resistance levels, an intermediate resistance at 1.2503 has acted as a significant resistance level in the past, having been tested multiple times.