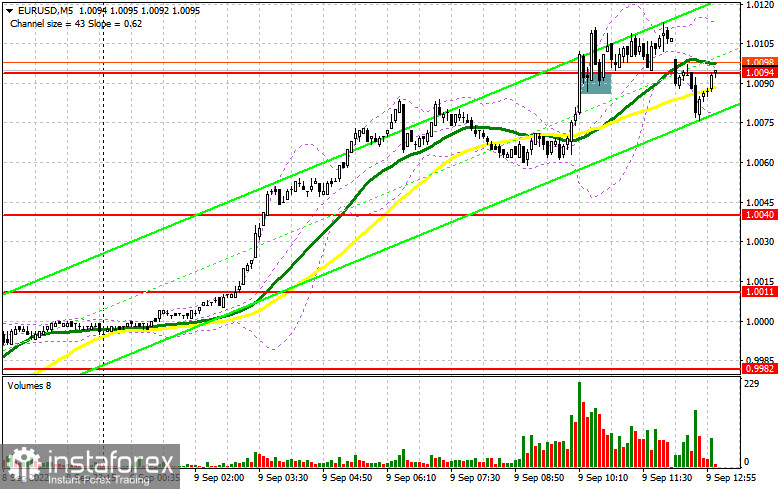
In my previous forecast, I drew your attention to the level of 1.0094 and recommended entering the market from it. Let us have a look at the 5-minute chart and analyze the situation. The euro continued its rally during the European session after yesterday's ECB decision to raise interest rates with a continued monetary policy stance. The breakthrough and the top/bottom test of 1.0094 gave an excellent entry point into long positions. After the 15 pips trough, buyers' activity dropped sharply. For the second half of the day, the technical picture changed completely.

Long positions on EUR/USD:
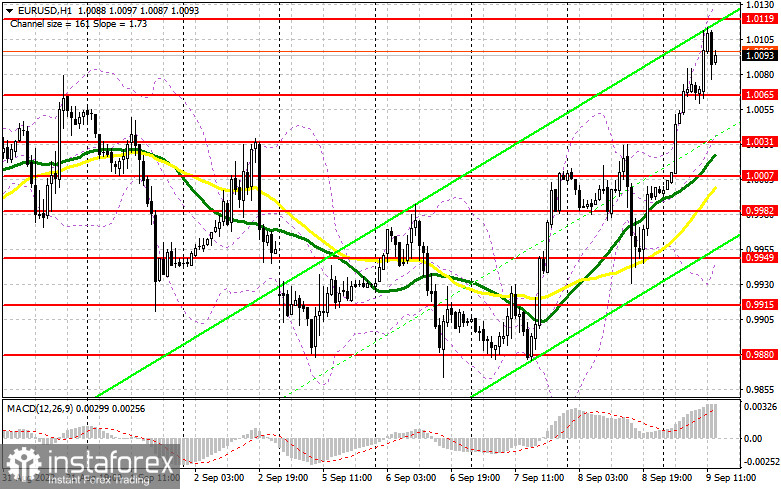
Obviously, there are not as many willing to buy the euro at the current highs as it might seem. Speculators are gradually exiting the market but the effect of the ECB actions, which lead to a slowdown in economic growth in the eurozone, remains. It is hard to say whether bulls will manage to reach another high at the end of the week since there are no important fundamental statistics in the second half of the day. Only the wholesale inventories report has been released and FOMC members Charles Evans and Christopher Waller are speaking. Yesterday, Fed Chairman Jerome Powell was speaking, so the statements of these FOMC members are unlikely to play a big role today. If the pressure on the pair remains at the beginning of the American session, the best scenario to buy it is a false breakout of the nearest support at 1.0065, which was formed in the first half of the day. It will give the entry point, counting on the continuation of the upward correction with the target of 1.0119. It is unlikely that we might see a breakout in this range. On the other hand, if that happens, only a top/bottom test of 1.0119 can trigger bears' Stop Loss orders, which will create an additional signal to open long positions with a possible correction to the area of 1.0162. The next target is located at resistance of 1.0200, where traders may lock in profits. If the euro/dollar pair declines and we see weak activity from bulls at 1.0065, or it can happen that bulls leave the market at the end of the week, the pressure on the pair is likely to return. The optimal solution to open long positions, in that case, is a false breakout at 1.0031, where the moving averages are passing, supporting bulls. You may buy the euro on a pullback from 1.0007 or lower at 0.9982, allowing an upward intraday correction of 30-35 pips.
Short positions on EUR/USD:
It all depends on whether bears will show some activity near the resistance of 1.0119 or not. The euro may rise in the afternoon, and a false breakout at 1.0119 might be an excellent entry point into short positions, counting on the downside correction at the end of the week. The target for the short positions is new support of 1.0065. A breakthrough and a fixation below this range, along with hawkish statements of the Fed representatives and a bottom/top test, will give an additional sell signal, which is likely to trigger buyers' Stop Loss orders and a drop towards 1.0031, where the moving averages are playing on the buyers' side. At that level, traders may take a profit. The next target is near the parity of the euro against the US dollar at 1.0007. If the pair bounces upwards during the US session and we see no activity from bears at 1.0119, the upward correction is likely to continue. In this scenario, it would be better to postpone opening short positions until the price reaches 1.0162 after a false breakout is formed there. It is possible to sell the euro on a rebound from the high of 1.0200 or higher from 1.0221, allowing a downward correction of 30-35 pips.

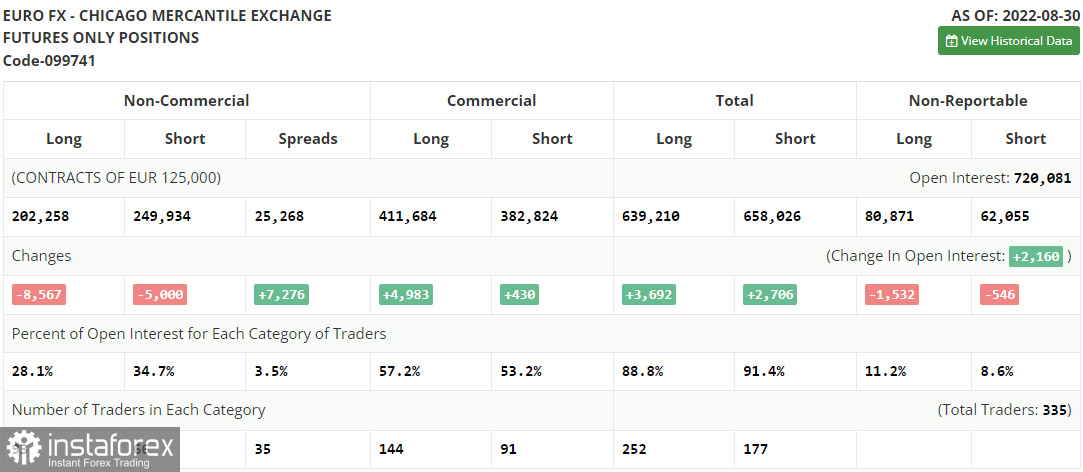
The COT report for August 30 logged a decline in both short and long positions. Last week, there was a burst of activity. However, there was a similar decline after a considerable increase. This indicates a decrease in investors' risk appetite after the data on inflation in the eurozone, which has once again risen to its highest level in the last decade. The problem is aggravated by the energy crisis as well since the gas supplies through the Nord Stream pipeline are suspended. This is likely to spur energy prices during winter and boost inflation rates, which will force the ECB to raise interest rates and tighten its monetary policy even more. This week, we also expect the regulator's decision on interest rates, which may aggravate the European currency's position against the US dollar. Though investors will take a hike in rates as a signal for higher yields, at the same time, there will be a slowdown in economic growth which is more important. Therefore, don't expect a major recovery in the euro in the medium term. The COT report indicates that long non-commercial positions declined by 8,567 to 202,258, while short non-commercial positions dropped by 5,000 to 249,934. At the end of the week, total non-commercial net positions remained negative, falling to -47,676 against -44,109, indicating continued pressure on the euro and a further drop in the trading instrument. The weekly closing price slightly recovered to 1.0033 against 0.9978.

Indicator signals:
Moving averages
The pair is trading above the 30- and 50-day moving averages, which indicates a further rise in the euro.
Note: Period and prices of moving averages are considered by the author on hourly chart H1 and differ from the common definition of classic daily moving averages on daily chart D1.
Bollinger Bands
If the pair declines, the bottom line of the indicator at 0.9949 will act as support.
Indicators description
- Moving average defines the current trend by smoothing out market volatility and noise. Period 50. Marked in yellow on the chart.
- Moving average defines the current trend by smoothing out market volatility and noise). Period 30. Marked in green on the chart.
- MACD (Moving Average Convergence/Divergence) indicator. Fast EMA 12. Slow EMA 26. SMA 9
- Bollinger Bands. Period 20
- Non-commercial traders are speculators, such as individual traders, hedge funds, and large institutions, which use the futures market for speculative purposes and meet certain requirements.
- Long non-commercial positions represent the total long open position of non-commercial traders.
- Short non-commercial positions represent the total short open position of noncommercial traders.
- Total non-commercial net position is the difference between short and long positions of non-commercial traders.
 English
 Русский
 Bahasa Indonesia
 Bahasa Malay
 ไทย
ไทย Español
 Deutsch
 Български
 Français
 Tiếng Việt
 中文
中文 বাংলা
বাংলা हिन्दी
 Čeština
 Українська
 Română

