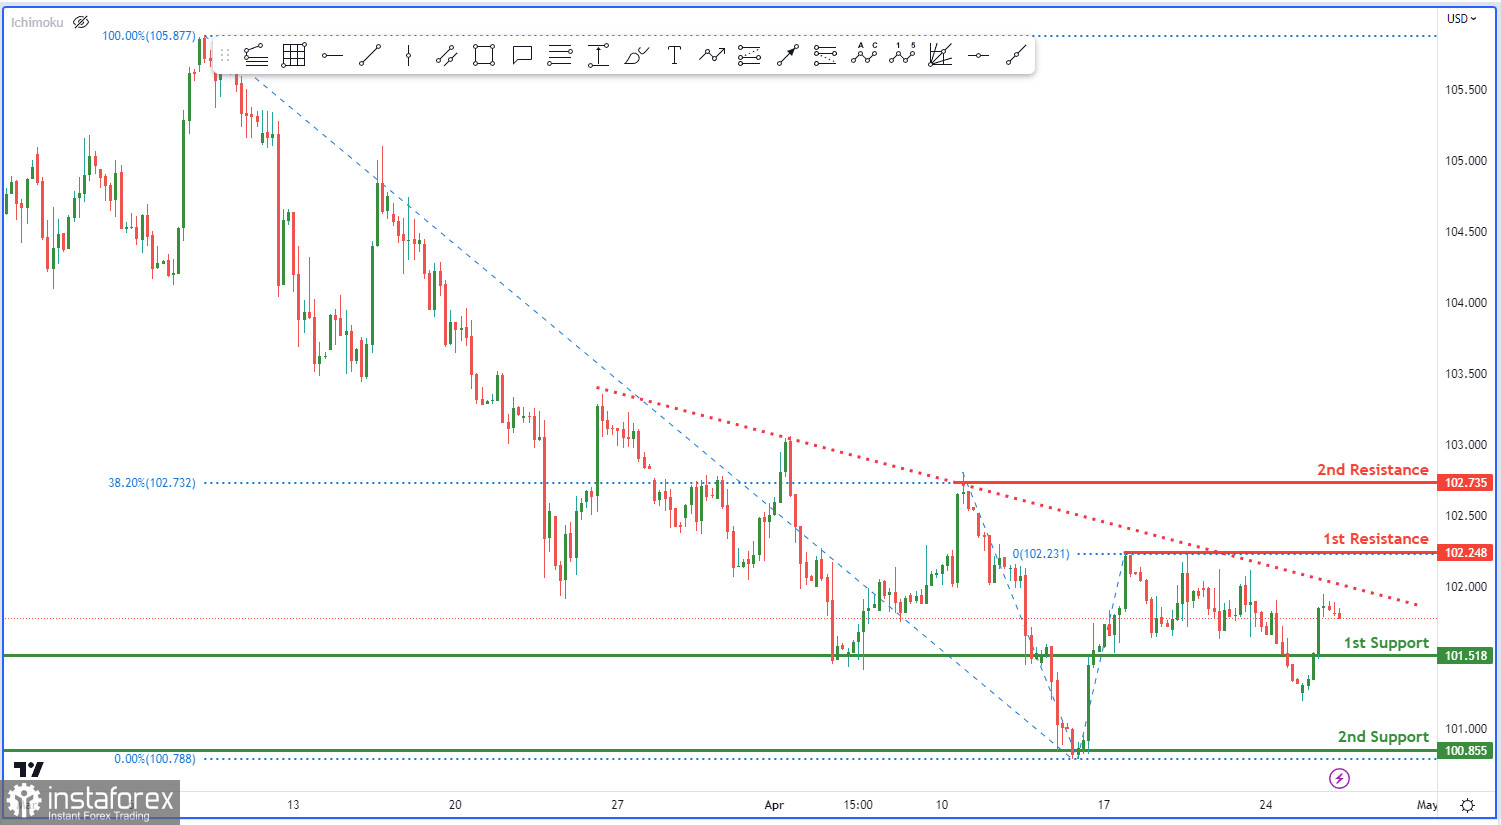
The DXY chart is currently exhibiting a bullish overall momentum, indicating that the price may potentially continue to rise towards the 1st resistance level.
The 1st support level is at 101.518 and may provide potential support for the price if it were to drop. This level is an overlap support. The next potential support level is at 100.855, which is also an overlap support and may provide additional support for the price if it were to drop further.
On the other hand, if the price were to rise, the 1st resistance level is at 102.248. This level is an overlap resistance and may provide potential resistance for the price if it were to rise.
If the price were to break above the 1st resistance level, the next potential resistance level is at 102.735. This level is also an overlap resistance and coincides with the 38.2% Fibonacci expansion, making it a strong level for potential resistance.
 English
 Русский
 Bahasa Indonesia
 Bahasa Malay
 ไทย
ไทย Español
 Deutsch
 Български
 Français
 Tiếng Việt
 中文
中文 বাংলা
বাংলা हिन्दी
 Čeština
 Українська
 Română

