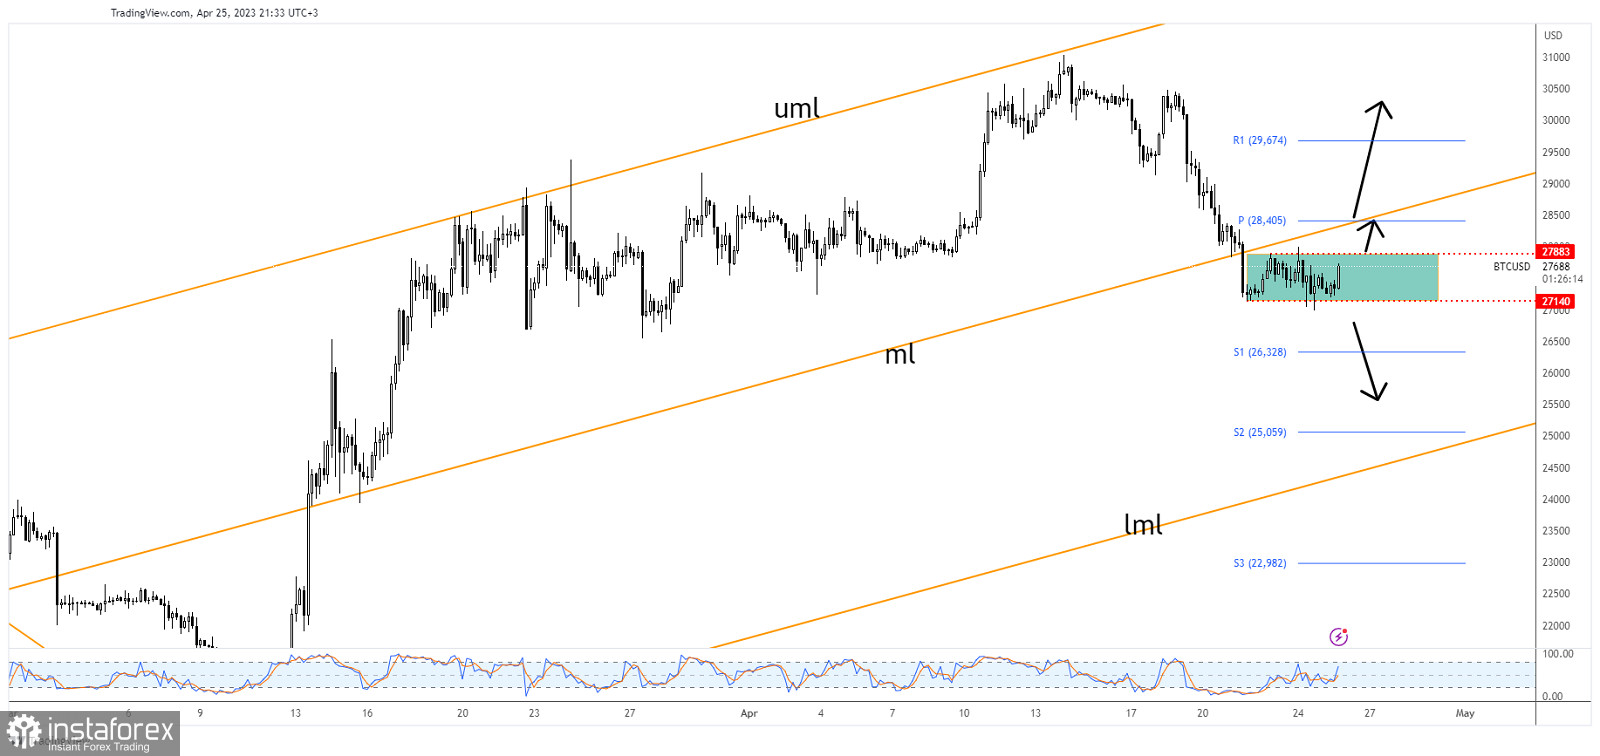
Bitcoin rallied in the last hours. It was trading at 27,633 at the time of writing. As long as the downside pressure remains high, the crypto could extend its downside movement anytime. Technically, a rebound was natural following a sell-off.
In the last 24 hours, BTC/USD was up by 0.92%, but it's down by 8.49% in the last 7 days. More declines should force the altcoins to drop as well.
BTC/USD tries to rebound

BTC/USD is trapped between the 27,140 and 27,883 levels. An escape from this pattern could bring new opportunities.
A drop below the median line (ml) signaled strong sellers and a potential deeper drop. The rate tried to test and retest the broken median line (ml) but it has failed, indicating strong downside pressure.
BTC/USD outlook
As you already know from my previous analysis, a bearish closure below 27,140 activates further drop and is seen as a selling opportunity.
 English
 Русский
 Bahasa Indonesia
 Bahasa Malay
 ไทย
ไทย Español
 Deutsch
 Български
 Français
 Tiếng Việt
 中文
中文 বাংলা
বাংলা हिन्दी
 Čeština
 Українська
 Română

