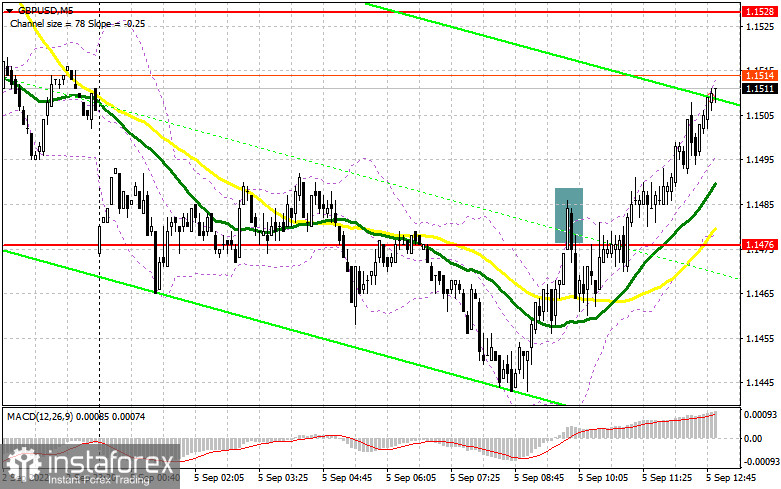
In my morning forecast, I paid attention to the level of 1.1476 and recommended making decisions on entering the market. Let's look at the 5-minute chart and figure out what happened. The growth and the formation of a false breakdown there at 1.1476 – all this led to a sell signal, which was not properly realized. Several more times, the bears tried to keep the pair below this level, but eventually allowed defeat, which led to the demolition of stop orders and fixing losses. In the afternoon, the technical picture changed, as has the strategy itself.

To open long positions on GBP/USD, you need:
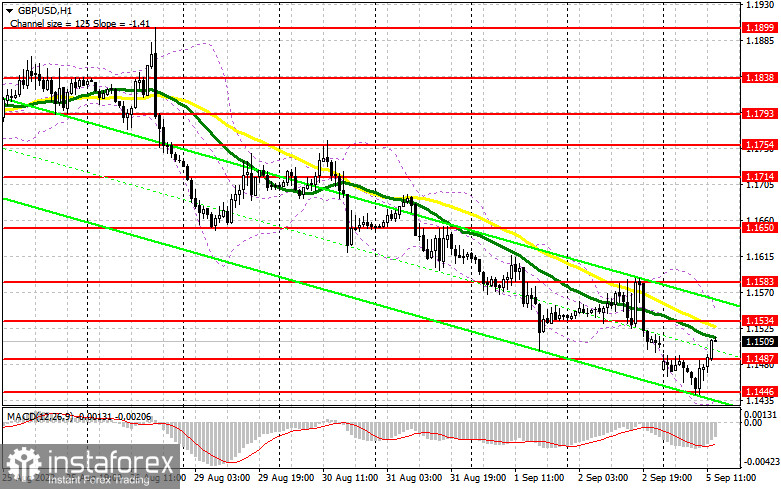
Given that today is a day off in the US, I expect limited volatility. According to my expectations, the upward correction for the pound will last until the resistance test of 1.1534, just above which the upper limit of the descending price channel formed on August 26th passes. But a much more important task for the bulls will not be the breakdown of this level but the protection of the new support of 1.1487 formed during the European session. In the case of regular sales of the pound, only the formation of a false breakdown there will give a buy signal to recover to 1.1534. In the area of this resistance, there are moving averages playing on the sellers' side, which will limit the upward potential. A breakdown and a reverse test from top to bottom of 1.1534 will help strengthen the position of buyers, opening the way to 1.1583, and a further target will be a maximum of 1.1650, where I recommend fixing the profits. If GBP/USD falls and there are no buyers at 1.1487, problems will return to the buyers of the pound. Below this level, a minimum of 1.1446 is visible, from which I also recommend opening long positions only when a false breakdown is formed. I advise buying GBP/USD immediately for a rebound from 1.1402 – the minimum of 2020, with a view to a correction of 30-35 points within a day.
To open short positions on GBP/USD, you need:
The bears did their best in the first half of the day, but it is obvious that there are fewer and fewer people willing to sell at annual lows. The ideal scenario would be the protection of a new resistance at 1.1534, a breakthrough that may occur in the very near future to close the morning gap. The formation of a false breakdown there will be the starting point for building up new short positions with a breakdown of the nearest support of 1.1487, also formed by the results of the first half of the day. A breakout and a reverse test from the bottom up of 1.1487 will give an entry point for sale with the prospect of a collapse to 1.1446, where I recommend fixing the profits. A more distant target will be the 1.1402 area. With the option of GBP/USD growth and the absence of bears at 1.1534, bulls will have a chance to correct and develop an upward movement at the beginning of this month. In this case, I advise you not to rush with sales: only a false breakdown in the area of 1.1583 forms a sell signal. It is possible to sell GBP/USD immediately for a rebound from the 1.1650 level, or even higher – around 1.1714, intending to move down by 30-35 points within a day.

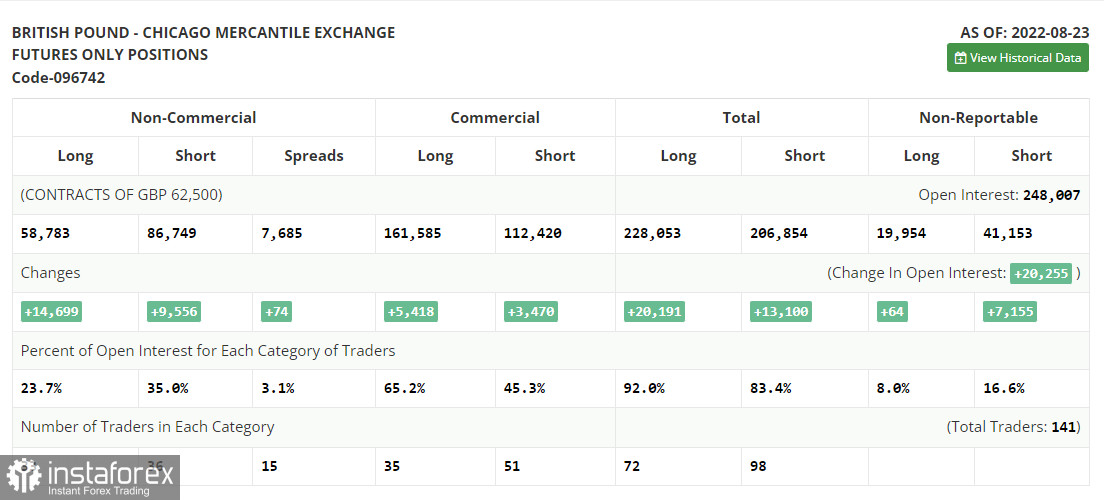
The COT report (Commitment of Traders) for August 23 recorded an increase in both short and long positions. And although there was a little more of the latter, these changes did not affect the real current picture. Serious pressure remains on the pair, and recent statements by Federal Reserve Chairman Jerome Powell that the committee will continue to raise interest rates at an aggressive pace have only increased pressure on the British pound, which has been experiencing quite a lot of problems lately. The expected high level of inflation and the escalating cost-of-living crisis in the UK do not give traders space to set long positions, as a fairly large number of weak fundamental statistics are expected ahead, which can certainly push the pound even lower than the levels at which it is currently trading. This week, it is important to pay attention to the data on the US labor market, on which, among other things, the decisions of the Federal Reserve System on monetary policy depend. Continued stability with minimal unemployment will lead to increased inflationary pressure in the future, which will force the Fed to further raise interest rates, putting pressure on risky assets, including the British pound. The latest COT report indicates that long non-commercial positions increased by 14,699, to the level of 58,783, while short non-commercial positions increased by 9,556, to the level of 86,749, which led to a slight increase in the negative value of the non-commercial net position - to the level of -27,966 versus – 33,109. The weekly closing price collapsed from 1.1822 to 1.2096.

Signals of indicators:
Moving Averages
Trading is below the 30 and 50-day moving averages, which indicates a further fall in the pound.
Note. The period and prices of moving averages are considered by the author on the hourly chart H1 and differ from the general definition of the classic daily moving averages on the daily chart D1.
Bollinger Bands
In the case of growth, the upper limit of the indicator at around 1.1540 will act as resistance. In the event of a decline, the lower limit of the indicator around 1.1446 will provide support.
Description of indicators
- Moving average (moving average determines the current trend by smoothing out volatility and noise). Period 50. The graph is marked in yellow.
- Moving average (moving average determines the current trend by smoothing out volatility and noise). Period 30. The graph is marked in green.
- MACD indicator (Moving Average Convergence / Divergence - moving average convergence/divergence) Fast EMA period 12. Slow EMA period 26. SMA period 9
- Bollinger Bands (Bollinger Bands). Period 20
- Non-profit speculative traders, such as individual traders, hedge funds, and large institutions use the futures market for speculative purposes and to meet certain requirements.
- Long non-commercial positions represent the total long open position of non-commercial traders.
- Short non-commercial positions represent the total short open position of non-commercial traders.
- Total non-commercial net position is the difference between the short and long positions of non-commercial traders.
 English
 Русский
 Bahasa Indonesia
 Bahasa Malay
 ไทย
ไทย Español
 Deutsch
 Български
 Français
 Tiếng Việt
 中文
中文 বাংলা
বাংলা हिन्दी
 Čeština
 Українська
 Română

