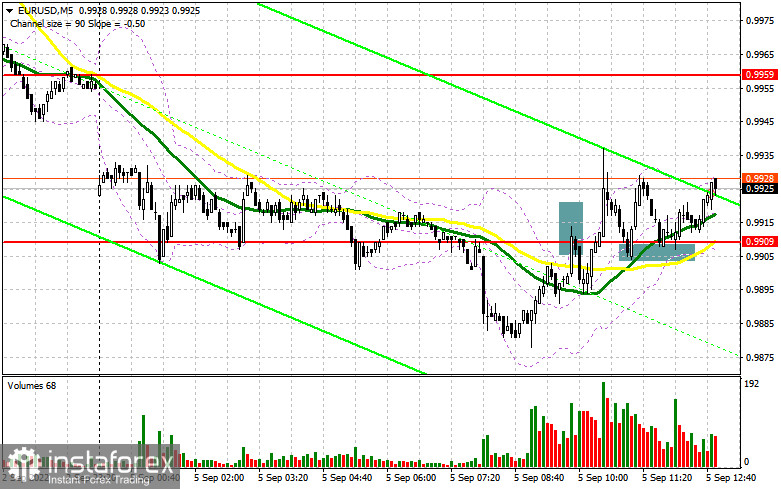
In my morning forecast, I paid attention to the 0.9909 level and recommended making decisions on entering the market from it. Let's look at the 5-minute chart and figure out what happened there. Growth and the formation of a false breakout at this level led to an excellent entry point into short positions. However, despite the weak fundamental statistics and the expectation of the continuation of the bear market, the pair recovered, which led to the fixation of losses. A breakout and a reverse test of 0.9909 from top to bottom gave a buy signal. At the time of the article, the upward movement was about 30 points. From a technical point of view, a lot has changed for the afternoon.

To open long positions on EURUSD, you need:
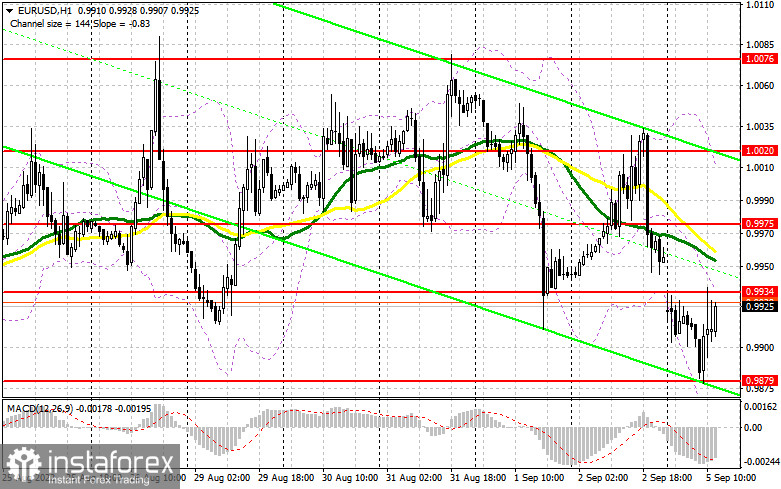
Given that today is Labor Day in the United States, volatility promises to be quite restrained. The bulls will try to offer something in the area of the nearest resistance 0.9934, formed at the end of the first half of the day, but all the emphasis will be placed on the support level of 0.9879, which was also formed during the European session. So far, this is a new annual minimum, and a lot depends on the behavior of the euro on it. In the case of another wave of falling EUR/USD, only the formation of a false breakdown in the area of 0.9879 will give an excellent entry point into long positions with the expectation of a return to 0.9934. A breakout and a top-down test of this range, which is gradually brewing, will hit the bears' stop orders and form an additional incentive for purchases to return to parity. However, before that, buyers will need to offer something above 0.9975. A more distant target will be the resistance of 1.0020, where I recommend fixing profits. If EUR/USD declines and there are no buyers at 0.9879 in the afternoon, the pressure on the pair will increase. The optimal solution for opening long positions, in this case, will be a false breakdown near the next low of 0.9819. I advise buying EUR/USD immediately for a rebound only from 0.9770, or even lower – in the area of 0.9723 parity with the aim of an upward correction of 30–35 points within a day.
To open short positions on EURUSD, you need:
The sellers of the euro are still not very glued to the continuation of the bearish scenario, so before opening short positions, I advise you to wait for the closing of the morning gap, which should just happen around 0.9975. But before this level, there is another intermediate resistance level of 0.9934, for which a fight may also break out. However, to protect this range, bears will need good statistics on the United States, which is not expected today. The optimal scenario for opening short positions will be a false breakdown in the resistance area of 0.9934, which will lead to a sell signal and the movement of the euro further down the trend, to the area of 0.9879. A breakdown and consolidation below this range, as well as a reverse test from the bottom up, will give an additional entry point for sale with a larger movement of the pair to the area of 0.9819, where I recommend fixing profits. A more distant target would be the 0.9770 area. In the event of an upward movement of EUR/USD in the afternoon, as well as the absence of bears at 0.9934, as I have already said, it is best to focus on sales in the area of the next resistance at 0.9975, where the moving averages are playing on the sellers' side. I advise you to sell there, provided that a false breakdown is formed. Short positions on EUR/USD can be immediately rebounded from the maximum of 1.0020, or even higher – from 1.0076 with the aim of a downward correction of 30-35 points.

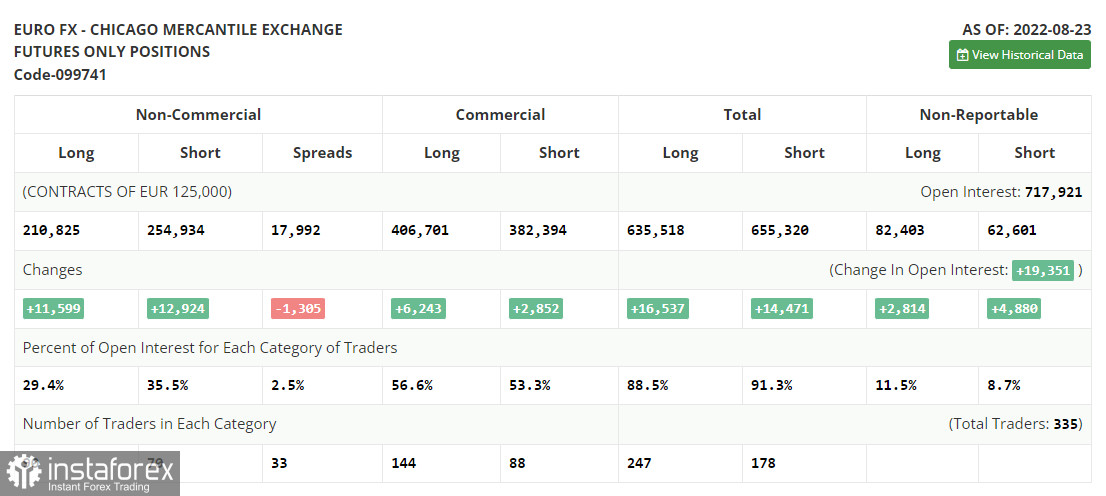
The COT report (Commitment of Traders) for August 23 recorded a sharp increase in both short and long positions. This indicates a fairly high appetite of traders, especially after the update of the parity of the euro against the US dollar. The speech of the Chairman of the Federal Reserve System, Jerome Powell, in Jackson Hole, led to a surge in volatility and provided temporary support for the dollar. However, the big players do not want to let the pair go below parity and act more actively each time on the decline. Jerome Powell said that the Fed will continue to fight inflation with all its might and noted the likely continuation of the previous pace of interest rate hikes during the September meeting. But the markets were already laying the ground for such changes, and this did not lead to the collapse of the European currency against the dollar. This week, it is necessary to analyze data on the American labor market, which will seriously affect the plans of the Federal Reserve System. A strong labor market will keep inflation at a high level, which will force the central bank to raise interest rates further. The COT report indicates that long non-commercial positions increased by 11,599, to a level of 210,825, while short non-commercial positions jumped by 12,924, to a level of 254,934. At the end of the week, the total non-commercial net position remained negative and decreased to -44,109 against -42,784, which indicates continued pressure on the euro and a further fall in the trading instrument. The weekly closing price decreased to 0.9978 against 1.0191.

Signals of indicators:
Moving Averages
Trading is below the 30 and 50-day moving averages, which indicates a further fall in the euro.
Note. The period and prices of moving averages are considered by the author on the hourly chart H1 and differ from the general definition of the classic daily moving averages on the daily chart D1.
Bollinger Bands
In the event of a decline, the lower limit of the indicator around 0.9879 will act as support.
Description of indicators
- Moving average (moving average determines the current trend by smoothing out volatility and noise). Period 50. The graph is marked in yellow.
- Moving average (moving average determines the current trend by smoothing out volatility and noise). Period 30. The graph is marked in green.
- MACD indicator (Moving Average Convergence / Divergence - moving average convergence/divergence) Fast EMA period 12. Slow EMA period 26. SMA period 9
- Bollinger Bands (Bollinger Bands). Period 20
- Non-profit speculative traders, such as individual traders, hedge funds, and large institutions use the futures market for speculative purposes and to meet certain requirements.
- Long non-commercial positions represent the total long open position of non-commercial traders.
- Short non-commercial positions represent the total short open position of non-commercial traders.
- Total non-commercial net position is the difference between the short and long positions of non-commercial traders.
 English
 Русский
 Bahasa Indonesia
 Bahasa Malay
 ไทย
ไทย Español
 Deutsch
 Български
 Français
 Tiếng Việt
 中文
中文 বাংলা
বাংলা हिन्दी
 Čeština
 Українська
 Română

