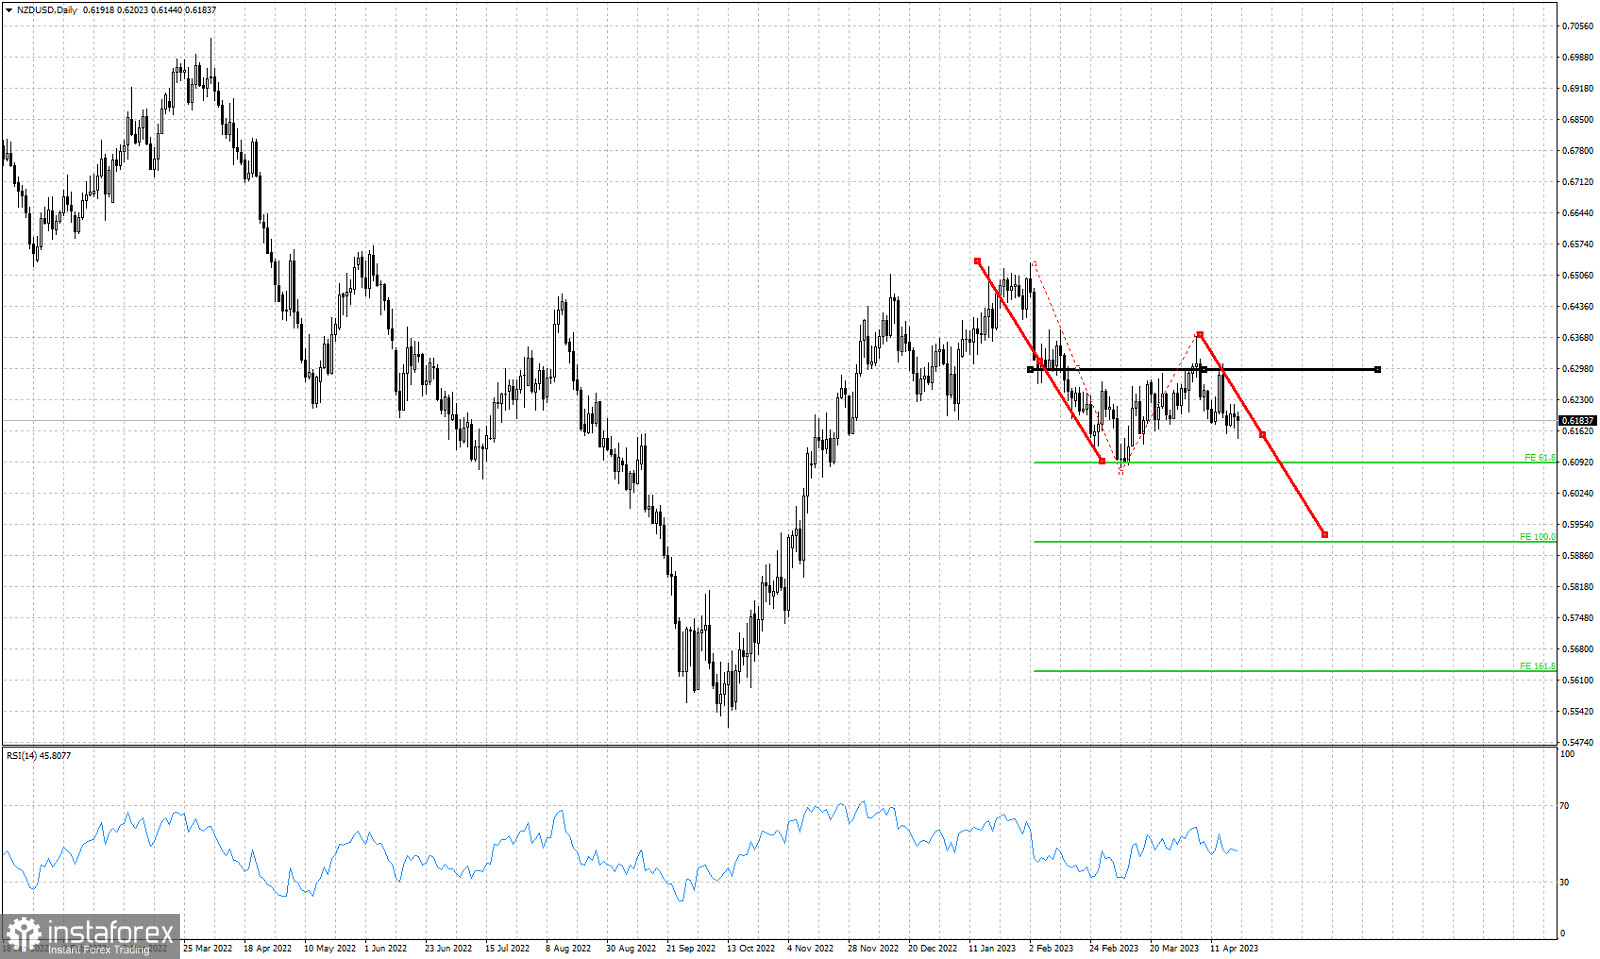
Red lines- equal size declines
Green lines- Fibonacci extension targets
Black line -pivot point
NZDUSD is trading around 0.6185. Recent price behavior with the formation of lower highs suggests that it is more likely we see lower lows. Price has the potential to continue its move lower towards 0.60-0.59 if the second leg down is equal to the first pull back. Resistance is found at 0.6365-0.6305. This is very important resistance area as price has tested this level several times confirming its importance. Support is at the recent lows around 0.6085-0.6090. A break below this level will increase chances of reaching the 100% Fibonacci extension target. As long as price is below 0.63-0.6365 we remain bearish.
 English
 Русский
 Bahasa Indonesia
 Bahasa Malay
 ไทย
ไทย Español
 Deutsch
 Български
 Français
 Tiếng Việt
 中文
中文 বাংলা
বাংলা हिन्दी
 Čeština
 Українська
 Română

