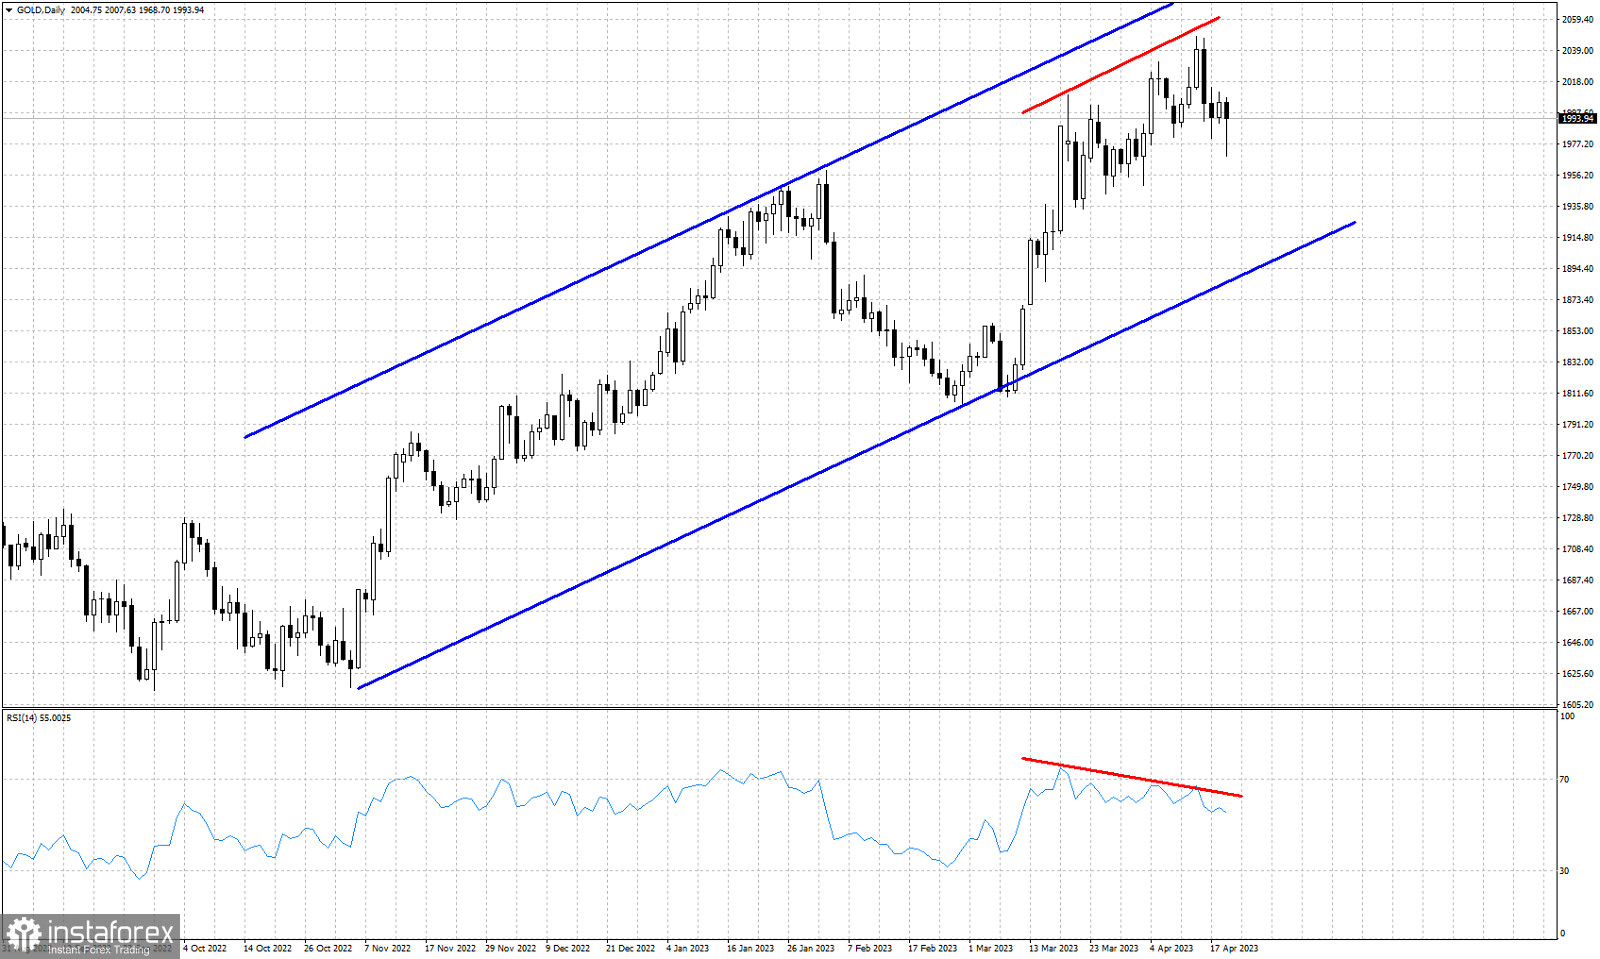
Blue lines- bullish channel
Red lines- bearish divergence
Gold price had a volatile day today. Price made new lower lows at $1,968 briefly breaking below key short-term support of $1,990. Bulls stepped in and pushed price back above $1,990. A daily close below $1,990 would be a sign of weakness. As we mentioned in previous posts, the bearish RSI divergence suggests that there is limited upside potential and that price is vulnerable to a pull back. Our most probable target is the lower channel boundary around $1,900.
 English
 Русский
 Bahasa Indonesia
 Bahasa Malay
 ไทย
ไทย Español
 Deutsch
 Български
 Français
 Tiếng Việt
 中文
中文 বাংলা
বাংলা हिन्दी
 Čeština
 Українська
 Română

