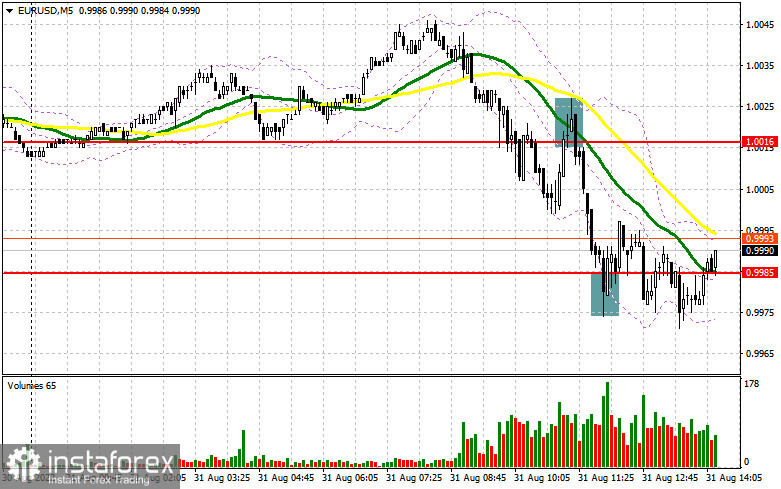
In the morning article, I highlighted the level of 1.0016 and recommended making decisions with this level in focus. Now, let's look at the 5-minute chart and try to figure out what actually happened. A breakout and an upward test of 1.0016 gave an excellent sell signal. The eurozone inflation report escalated pressure on the euro/dollar pair. It decreased to 0.9985. The downward movement totaled 30 pips. A false breakout of 0.9985 provided a buy signal. At the time of writing the article, I had not discerned a visible upward movement of the euro. For this reason, I decided to exit the market to avoid losses. For the afternoon, the technical outlook has changed.

What is needed to open long positions on EUR/USD
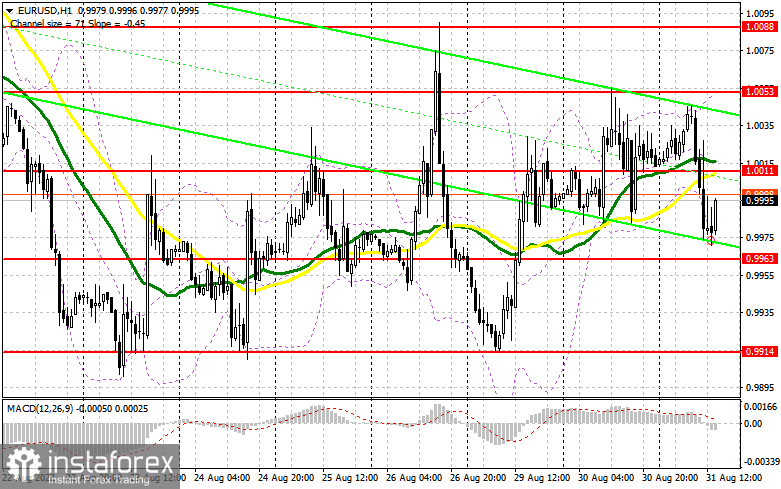
Inflation in the euro area skyrocketed to 9.1%, undermining the upward movement of the euro. The majority of ECB policymakers are speaking in favor of sharp rate hikes. European Central Bank Governing Council member Joachim Nagel said that concerns over an economic contraction in the euro area shouldn't derail increases in borrowing costs to counter record inflation. Germany's labor market data was in line with economists' forecasts. In the American session, the US will unveil a batch of crucial economic reports. If the ADP report and the Chicago PMI Index are positive, it may trigger another major sell-off of the euro as it was yesterday. This scenario may come true only if the figures top analysts' expectations. Given that today is the last day of the month, the euro will hardly drop to the yearly lows. If the euro moves down, bulls will try to defend 0.9963. A false breakout of this level will give a good buy signal with the prospect of an upward correction or at least for a consolidation in a wider sideways channel. The nearest target will be the 1.0011 level. The bulls need to return control over this level as soon as possible. If they fail, the pressure on the pair, which is trading below the parity level, will only increase. A breakout and a downward test of 1.0011 will force bears to close their Stop Loss orders. Traders will be more willing to buy the euro above the parity level. It may lead to a correction to 1.0053. A more distant target will be the resistance level of 1.0088 where I recommend locking in profits. If EUR/USD declines and bulls show no activity at 0.9963 in the afternoon, the pair is likely to face strong bearish pressure. The optimal scenario for opening long positions will be a false breakout near the low of 0.9914. You can buy EUR/USD immediately at a bounce from 0.9861 or near the parity level at 0.9819, keeping in mind an upward intraday correction of 30-35 pips.
What is needed to open short positions on EUR/USD
Bears were able to assert strength thanks to weak fundamental reports. The euro area is scheduled to reveal many economic reports soon. Bulls will certainly try to regain ground and push the pair above the parity level in the afternoon. The optimal scenario for opening short positions will be a false breakout a new resistance level of 1.0011. It could generate a sell signal. The euro will retreat to 0.9963. A breakout below this level if macro stats are upbeat as well as an upward test will provide an additional sell signal. In this case, the pair is likely to drop to 0.9914 where I recommend locking in profits. A more distant target will be the 0.9861 level. If EUR/USD rises in the afternoon and bears show no energy at 1.0011, bulls are likely to take the upper hand. In this case, it is better to postpone short positions to 1.0053 but only if a false breakout occurs. You can sell EUR/USD immediately at a bounce from a high of 1.0088 or from 1.0127, keeping in mind a downward intraday correction of 30-35 pips.

COT report
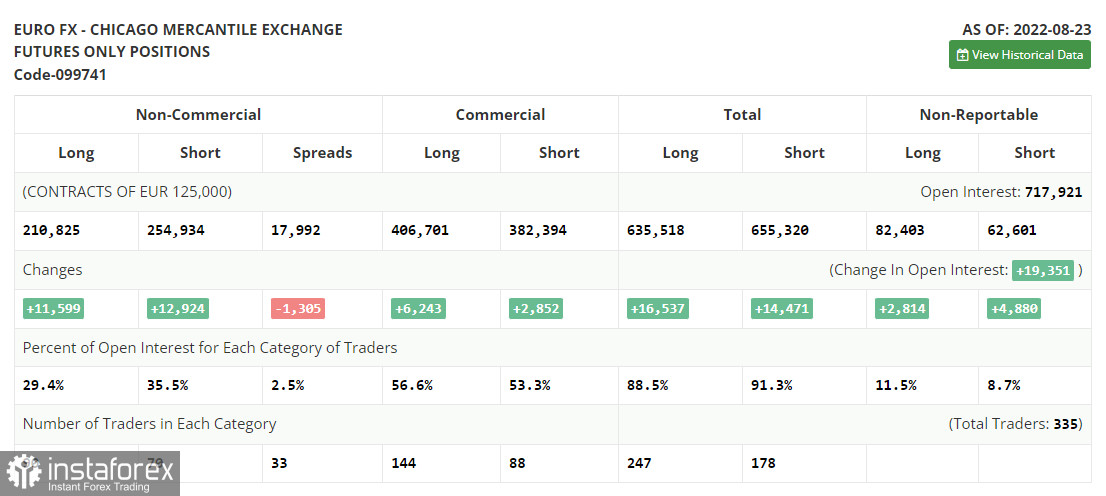
The COT report (Commitment of Traders) for August 23 logged a sharp increase in both short and long positions. It indicates a high risk appetite among traders, especially after the price approached the parity level. Jerome Powell's speech at the Jackson Hole Symposium led to a surge in volatility and facilitated a short-term rally of the US dollar. However, large retail traders try to prevent the pair from decreasing below the parity level. They begin to enter the market each time the pair start declining. Jerome Powell said that the Fed's main priority is to curb inflation. He also hinted at another sharp rate hike at the September meeting. Investors have priced it in already. So, it did not lead to a drastic drop in the euro versus the US dollar. This week, the Nonfarm Payrolls report is due. The Fed is sure to take notice of this report as it may impact the regulator's monetary policy decision. A strong labor market will keep boosting inflation, which may force the watchdog to raise interest rates further. The COT report revealed that the number of long non-commercial positions increased by 11,599 to 210,825, while the number of short non-commercial positions jumped by 12,924 to 254,934. At the end of the week, the total non-commercial net position remained negative and decreased to -44,109 against -42,784, signaling pressure on the euro and a further fall in the trading instrument. The weekly closing price declined to 0.9978 against 1.0191.

Signals of technical indicators
Moving averages
EUR/USD is trading near 30- and 50-period moving averages, signaling market uncertainty.
Remark. The author is analyzing the period and prices of moving averages on the 1-hour chart. So, it differs from the common definition of classic daily moving averages on the daily chart.
Bollinger Bands
If EUR/USD goes down, the indicator's lower border at 0.9960 will serve as support. Otherwise, if the currency pair grows, the upper border at 1.0053 will act as resistance.
Definitions of technical indicators
- Moving average recognizes an ongoing trend through leveling out volatility and market noise. A 50-period moving average is plotted yellow on the chart.
- Moving average identifies an ongoing trend through leveling out volatility and market noise. A 30-period moving average is displayed as the green line.
- MACD indicator represents a relationship between two moving averages that is a ratio of Moving Average Convergence/Divergence. The MACD is calculated by subtracting the 26-period Exponential Moving Average (EMA) from the 12-period EMA. A 9-day EMA of the MACD called the "signal line".
- Bollinger Bands is a momentum indicator. The upper and lower bands are typically 2 standard deviations +/- from a 20-day simple moving average.
- Non-commercial traders - speculators such as retail traders, hedge funds, and large institutions who use the futures market for speculative purposes and meet certain requirements.
- Non-commercial long positions represent the total long open position of non-commercial traders.
- Non-commercial short positions represent the total short open position of non-commercial traders.
- The overall non-commercial net position balance is the difference between short and long positions of non-commercial traders.
 English
 Русский
 Bahasa Indonesia
 Bahasa Malay
 ไทย
ไทย Español
 Deutsch
 Български
 Français
 Tiếng Việt
 中文
中文 বাংলা
বাংলা हिन्दी
 Čeština
 Українська
 Română

