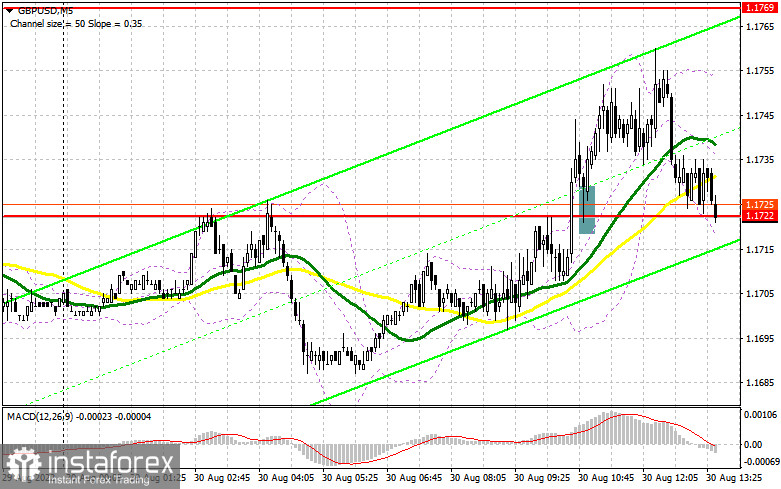
In my morning forecast, I paid attention to the 1.1722 level and recommended making decisions on entering the market from it. A further upward correction of the pound was not long in coming. A breakout and a reverse test from the top down of this range gave a buy signal, which eventually resulted in a sharp upward movement of more than 30 points. Unfortunately, we did not reach the nearest resistance at 1.1769, so I could not enter short positions from there. In the afternoon, the technical picture was completely revised.

To open long positions on GBP/USD, you need:
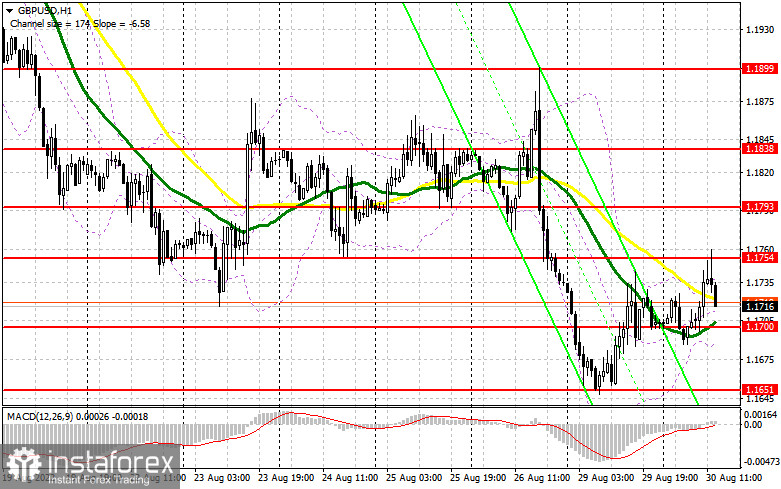
All the bulls' attempts to build an upward correction for the pair are being implemented by 100% so far – they manage to update the daily highs, and this is a sure sign of the formation of an upward trend, even if it is only of a corrective nature within the framework of a large bear market. In the afternoon, I advise you to pay attention to the indicator of consumer confidence in the United States. It may grow, along with which the GBP/USD pair will fall, as well as statements made by FOMC members Thomas Barkin and John Williams, who will give a speech later. In other words, traders will look for hints about the Fed's attitude to the further course of monetary policy, although without them, everything is clear what is moving and where. If the pair moves down in the afternoon, an important task for buyers will be to protect the new support of 1.1700, formed following the results of the European session, where the moving averages also play on the bulls' side. Only the formation of a false breakdown there will give a buy signal to recover to the area of 1.1754, which also came out of the European session. A breakdown and a reverse test from top to bottom of this range will help strengthen the position of buyers, opening the way to 1.1793, and a further target will be a maximum of 1.1838, where I recommend fixing the profits. Updating this level will call into question the ability of sellers to control the market further, so pay special attention to it. If the GBP/USD falls and there are no buyers at 1.1700, the bulls will have serious problems again since, at that time, they will start talking about the resumption of the bearish medium-term trend. Below this level, only the minimum of 1.1651 remains, from which I also recommend opening long positions only when a false breakdown is formed. I advise buying GBP/USD immediately for a rebound from 1.1573, or even lower – around 1.1499, with a view to a correction of 30–35 points within a day.
To open short positions on GBP/USD, you need:
It is very important for bears to defend the resistance of 1.1754 today, from which, when a false breakdown is formed, I expect a resumption of the decline of GBP/USD and a return to the intermediate support of 1.1700, where the lower boundary of the new upward correction channel passes. For this reason, sellers need to return to this level as soon as possible. A breakthrough to 1.1700 may occur in the case of hawkish statements by representatives of the Federal Reserve System or after strong data on the US consumer confidence indicator. A breakthrough and a reverse test from the bottom up of 1.1700 will give an entry point for sale with the prospect of reaching 1.1651 – the annual minimum, below which the levels of 1.1573 and 1.1499 open, where I recommend fixing the profits. With the option of GBP/USD growth and the absence of bears at 1.1754, bulls will have a real chance for a more powerful correction and the development of a sharp upward movement. In this case, I advise you not to rush with sales: only a false breakdown in the area of 1.1793 will give an entry point into short positions. It is possible to sell GBP/USD immediately for a rebound from the 1.1838 level, but only to move down by 30-35 points within a day.

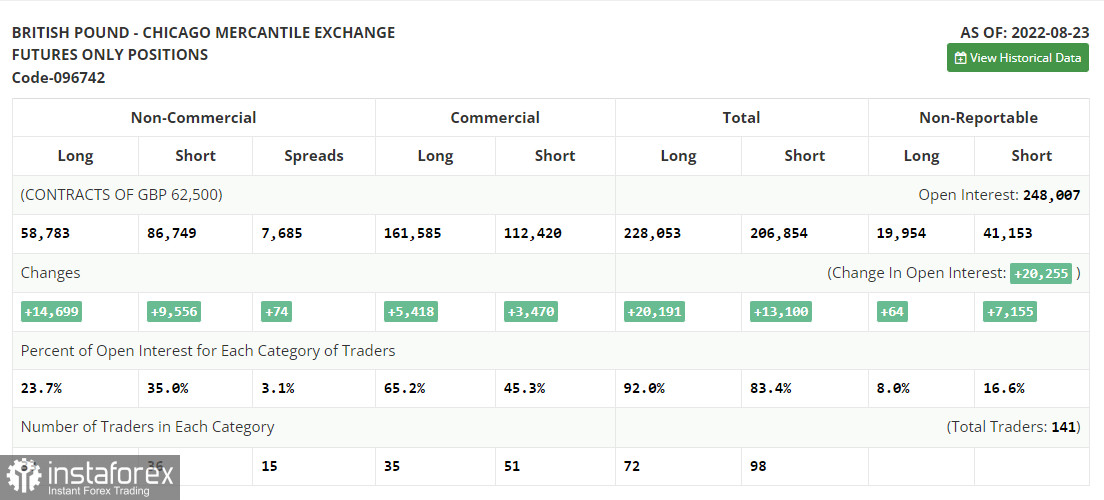
The COT report (Commitment of Traders) for August 23 recorded an increase in both short and long positions. And although there was a little more of the latter, these changes did not affect the real current picture. Serious pressure remains on the pair. Moreover, recent statements by Federal Reserve Chairman Jerome Powell that the committee will continue to raise interest rates at an aggressive pace have only increased pressure on the British pound, which has been experiencing many problems lately. The expected high level of inflation and the escalating cost-of-living crisis in the UK do not give traders space to set long positions. It is because a fairly large number of weak fundamental statistics are expected ahead, which can push the pound even lower than the levels it is currently trading. This week, it is important to pay attention to the data on the US labor market, on which, among other things, the decisions of the Federal Reserve System on monetary policy depend. Continued stability with minimal unemployment will lead to increased inflationary pressure in the future, forcing the Fed to raise interest rates further and putting pressure on risky assets, including the British pound. The latest COT report indicates that long non-commercial positions increased by 14,699 to 58,783. In contrast, short non-commercial positions increased by 9,556 to 86,749, which led to a slight increase in the negative value of the non-commercial net position - to the level of -27,966 versus -33,109. The weekly closing price collapsed from 1.1822 to 1.2096.

Signals of indicators:
Moving Averages
Trading is conducted around the 30 and 50-day moving averages, which indicate the lateral nature of the market with a possible further fall of the pair.
Note. The author considers the period and prices of moving averages on the hourly chart H1 and differ from the general definition of the classic daily moving averages on the daily chart D1.
Bollinger Bands
In the case of growth, the upper limit of the indicator at around 1.1750 will act as resistance. In the event of a decline, the lower limit of the indicator, around 1.1700, will provide support.
Description of indicators
- Moving average (moving average determines the current trend by smoothing out volatility and noise). Period 50. The graph is marked in yellow.
- Moving average (moving average determines the current trend by smoothing out volatility and noise). Period 30. The graph is marked in green.
- MACD indicator (Moving Average Convergence / Divergence - moving average convergence/divergence) Fast EMA period 12. Slow EMA period 26. SMA period 9
- Bollinger Bands (Bollinger Bands). Period 20
- Non-profit speculative traders, such as individual traders, hedge funds, and large institutions use the futures market for speculative purposes and to meet certain requirements.
- Long non-commercial positions represent the total long open position of non-commercial traders.
- Short non-commercial positions represent the total short open position of non-commercial traders.
- Total non-commercial net position is the difference between the short and long positions of non-commercial traders.
 English
 Русский
 Bahasa Indonesia
 Bahasa Malay
 ไทย
ไทย Español
 Deutsch
 Български
 Français
 Tiếng Việt
 中文
中文 বাংলা
বাংলা हिन्दी
 Čeština
 Українська
 Română

