Review :
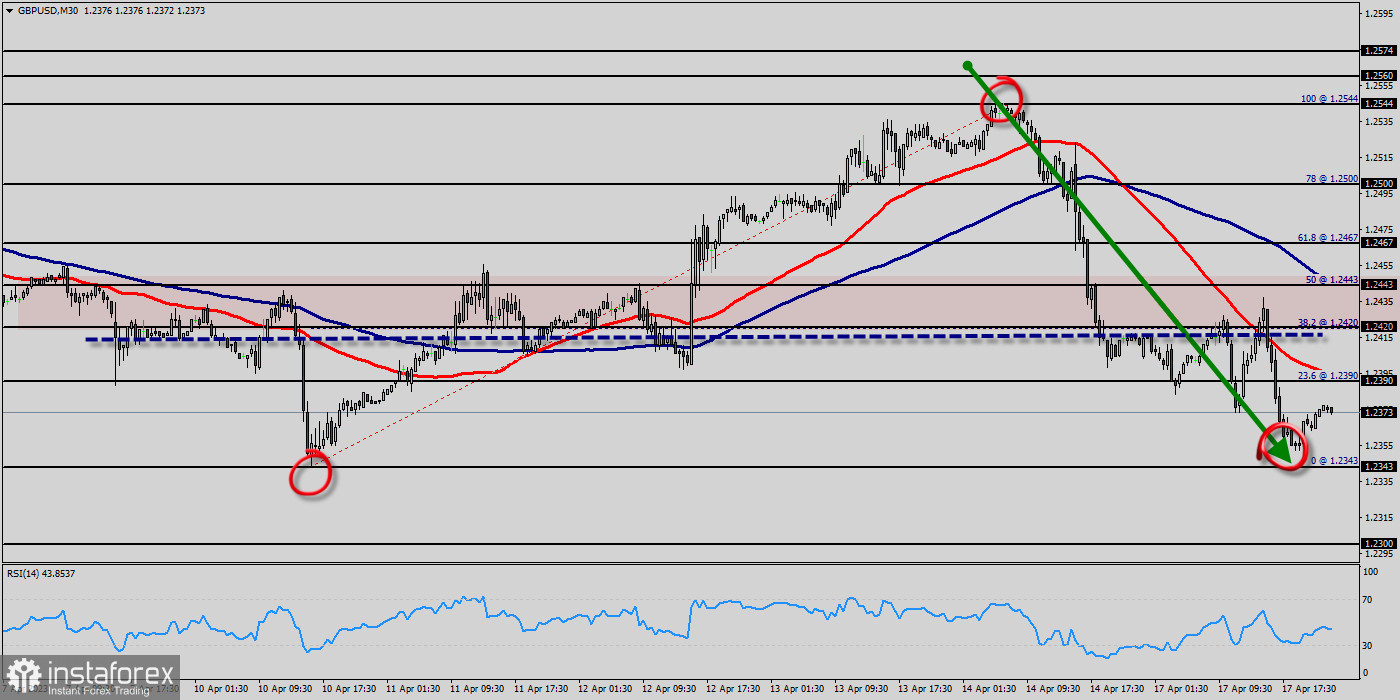
The GBP/USD pair is consolidating the pullback since hours highs below the last bullish wave of 1.2524 ahead of the key US economic data today. A cautious market mood is offering support to the safe-haven US Dollar and adds to the downside in Cable temporary. In long term, the GBP/USD pair has broken out above strong previous resistance in the 1.2396 area to hit a fresh three weeks high! At the same time, we've seen the pair's 14-day RSI indicator rally to its own highest level in months.
If this breakout holds throughout the rest of the week, it would signal that the longer-term trend has shifted back in favor of the buyers, opening the gate for a continuation toward previous resistance at 1.2524 (to form a double top on the hourly chart).
The GBPUSD pair provides slight positive trades to approach the broken support line of the minor bullish channel, as it is influenced by RSI (14) positivity, besides the EMA50 that forms good support against the price, to monitor the upcoming trading carefully, as the price needs to hold above the price of 1.2396 to keep the bullish trend valid for today, which its targets begin at 1.2524 and extend to 1.2560 sooner.
Closing above the daily pivot point (1.2396) could assure that the GBP/USD pair will move higher towards cooling new highs. The bulls must break through 1.2500 so as to resume the up trend.
Trading recommendations :
The trend is still bullish as long as the price of 1.2396 is not broken. Thereupon, it would be wise to buy above the price of at 1.2396 with the primary target at 1.2524. Then, the the GBP/USD pair will continue towards the second target at 1.2560. An uptrend will start as soon, as the market rises above last bullish wave level 1.2524, which will be followed by moving up to resistance level 1.2560. Further close above the high end may cause a rally towards $ 1.2610. Nonetheless, the weekly resistance level and zone should be considered. However, The breakdown of 1.2396 will allow the pair to go further down to the prices of 1.2303 and 1.2268.
 English
 Русский
 Bahasa Indonesia
 Bahasa Malay
 ไทย
ไทย Español
 Deutsch
 Български
 Français
 Tiếng Việt
 中文
中文 বাংলা
বাংলা हिन्दी
 Čeština
 Українська
 Română

