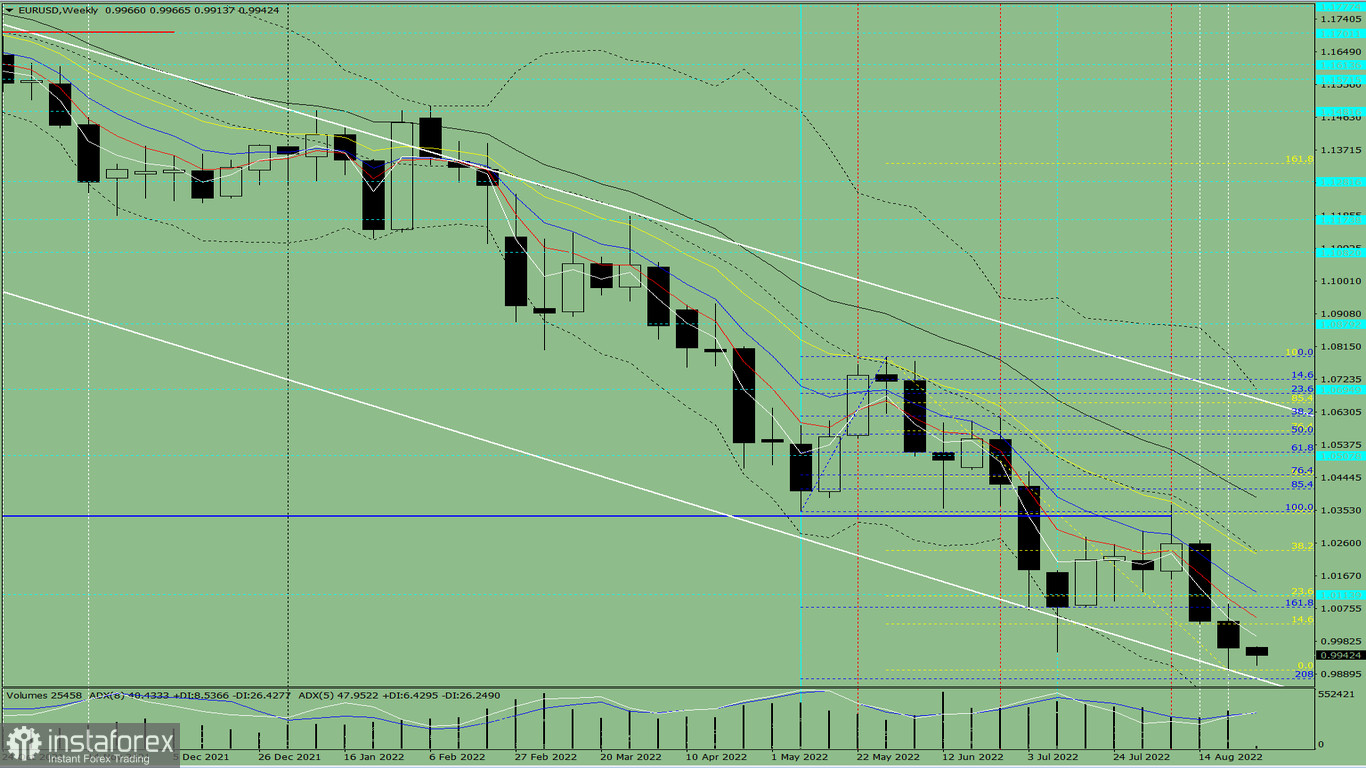
Trend-following analysis (picture 1)
This week, EUR/USD is likely to begin its upward move from 0.9900, the level of closing the last weekly candlestick. The currency pair aims to reach 1.0028 which coincides with the 14.6% retracement and is plotted by the yellow plotted line. From this level, the market will try to extend the upward move with the aim of testing the 23.6% retracement level or 1.0109 plotted by theyellow dotted line. When this level is tested, the price may continue its upward move with the higher target at 1.0237 which coincides with the 38.2% retracement plotted by the yellow dotted line.

Picture 1 (weekly chart).
Complex analysis
Indicator analysis – upFibonacci levels – upTrade volumes – upCandlestick analysis – upTrend-following analysis – upBollinger bands – down1-month chart – up
The conclusion from the complex analysis: EUR/USD is set to move up.
The candlestick of EUR/USD is expected to trade with a bullish bias according to the weeklychart. The weekly white candlestick lacks the first lower shadow which means an upward move on Monday. The candlestick has the second upper shadow which means a downward move on Friday.
This week, EUR/USD is likely to begin its upward move from 0.9900, the level of closing the last weekly candlestick. The currency pair aims to reach 1.0028 which coincides with the 14.6% retracement and is plotted by the yellow plotted line. From this level, the market will try to extend the upward move with the aim of testing the 23.6% retracement level or 1.0109 plotted by the yellow dotted line. When this level is tested, the price may continue its upward move with the higher target at 1.0237 which coincides with the 38.2% retracement plotted by the yellow dotted line.
Alternative scenario. From 0.9900 (the level of closing the last weekly candlestick), EUR/USD could begin its downward move, aiming to hit the target level of 0.9876 plotted by the blue dotted line that matches the 208.0% Fibonacci level. Once this level is reached, the market will try to start a climb with the aim of testing 1.0029 plotted by the yellow dotted line that matches the 14.6%Fibonacci retracement.
 English
 Русский
 Bahasa Indonesia
 Bahasa Malay
 ไทย
ไทย Español
 Deutsch
 Български
 Français
 Tiếng Việt
 中文
中文 বাংলা
বাংলা हिन्दी
 Čeština
 Українська
 Română

