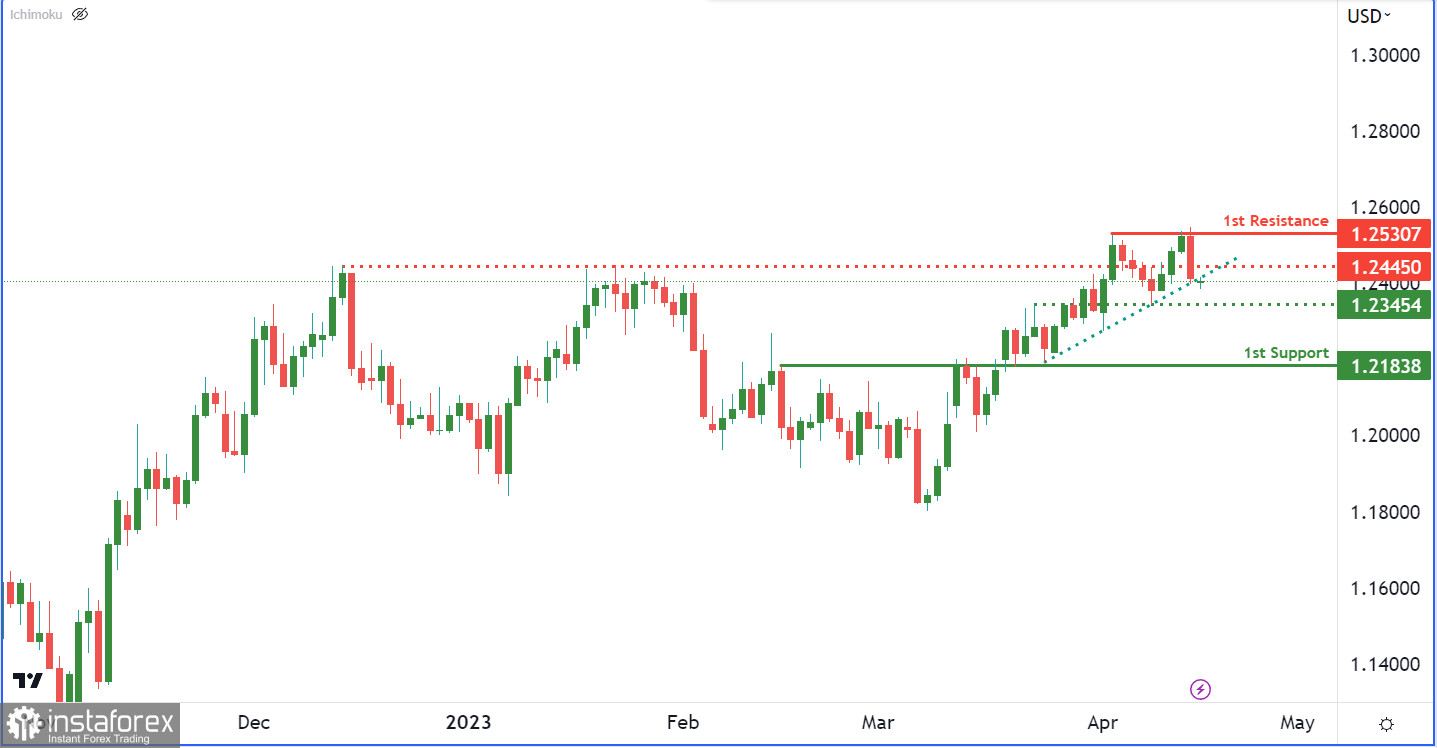
The GBP/USD chart currently exhibits a bearish momentum, largely due to the fact that the price is situated below a significant descending trend line. This suggests that there may be further bearish movement ahead. Moreover, a break below the ascending trend line could prompt the price to fall towards the 1st support level.
The 1st support level for GBP/USD is at 1.2183, and it is a strong overlap support that is situated on an ascending trend line. This support level has proven its resilience in the past. If the price were to breach this level, it may tumble further towards the intermediate support at 1.2345, which is another overlap support.
As for the resistance levels, the 1st resistance level is at 1.2530, and it is a crucial multi-swing high resistance to monitor for any bearish movements. Furthermore, there is an intermediate resistance level at 1.2445, which is also an overlap resistance. If the price manages to surpass this intermediate resistance, it could trigger a more powerful bullish push towards the 1st resistance.
 English
 Русский
 Bahasa Indonesia
 Bahasa Malay
 ไทย
ไทย Español
 Deutsch
 Български
 Français
 Tiếng Việt
 中文
中文 বাংলা
বাংলা हिन्दी
 Čeština
 Українська
 Română

