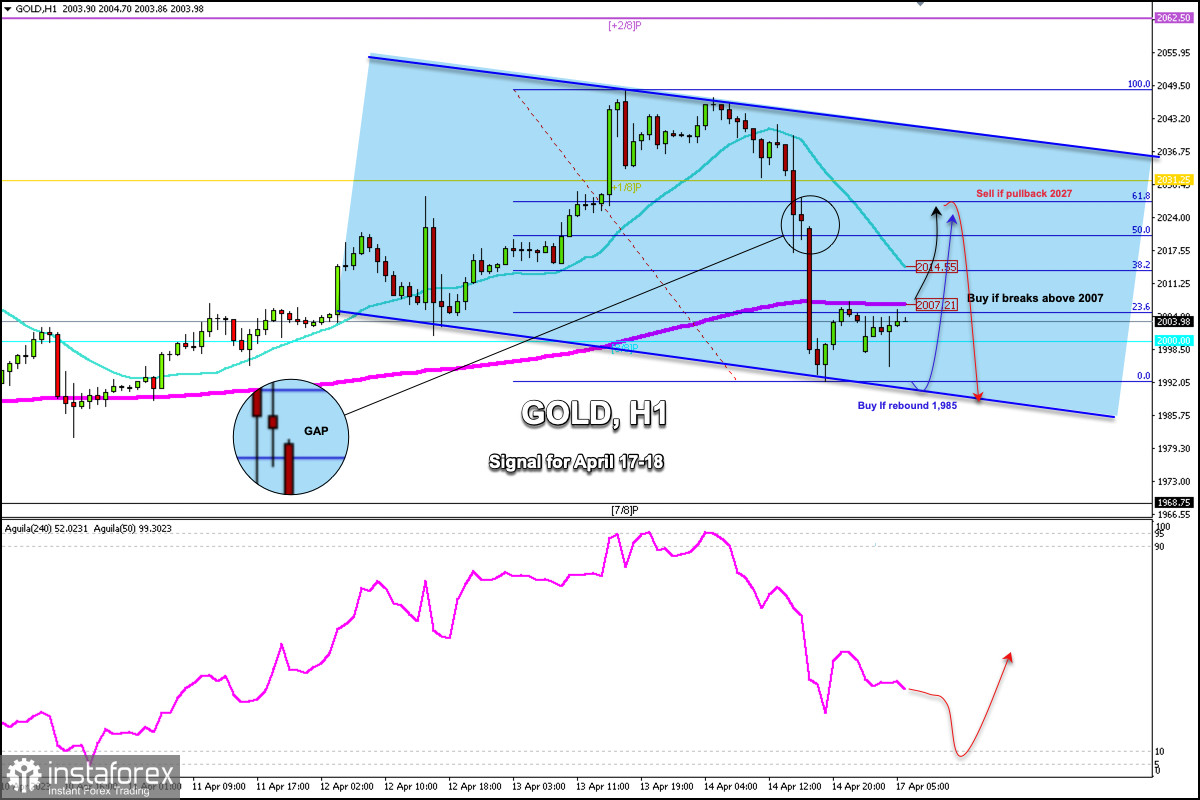
Early in the European session, Gold (XAU/USD) is trading around 2,003.98, below the 21 SMA, and below the 200 EMA. The instrument is under strong bearish pressure and any move towards the resistance zone is likely to be seen as a sell signal.
On April 13, gold reached a high of 2,048.73 and in less than 24 hours it fell to a low of 1,992.45. A depreciation of $55 is a sign of a technical correction in the short term.
In the 1-hour chart, we can see that gold left a GAP around 2,023.37. This occurred in light of the data on retail sales from the United States. In the next few hours, we expect gold to continue rebounding and reach the 2,026.45 area to cover the gap.
On the other hand, in case XAU/SD closes below the 200 EMA (2007), we can expect a retracement to the 1,985 level (daily support). Finally, this can accelerate its fall towards 7/8 Murray located at 1,968.
The eagle indicator is giving a negative signal but is approaching oversold levels. This could be seen as an opportunity to buy in case a technical bounce occurs around the bottom of the downtrend channel at 1,985.
In case gold breaks above the 200 EMA located at 2,007, the opportunity to buy with targets at 2,017 and 2,027 (GAP) could be activated.
According to the Fibonacci grid, the price has moved from the high at 2,048 towards the low of 1,992. The key level of 61.8% represents the zone of 2,027. This level could be seen as a signal to sell in case gold is rejected from this area.
 English
 Русский
 Bahasa Indonesia
 Bahasa Malay
 ไทย
ไทย Español
 Deutsch
 Български
 Français
 Tiếng Việt
 中文
中文 বাংলা
বাংলা हिन्दी
 Čeština
 Українська
 Română

