EUR/USD

Higher timeframes
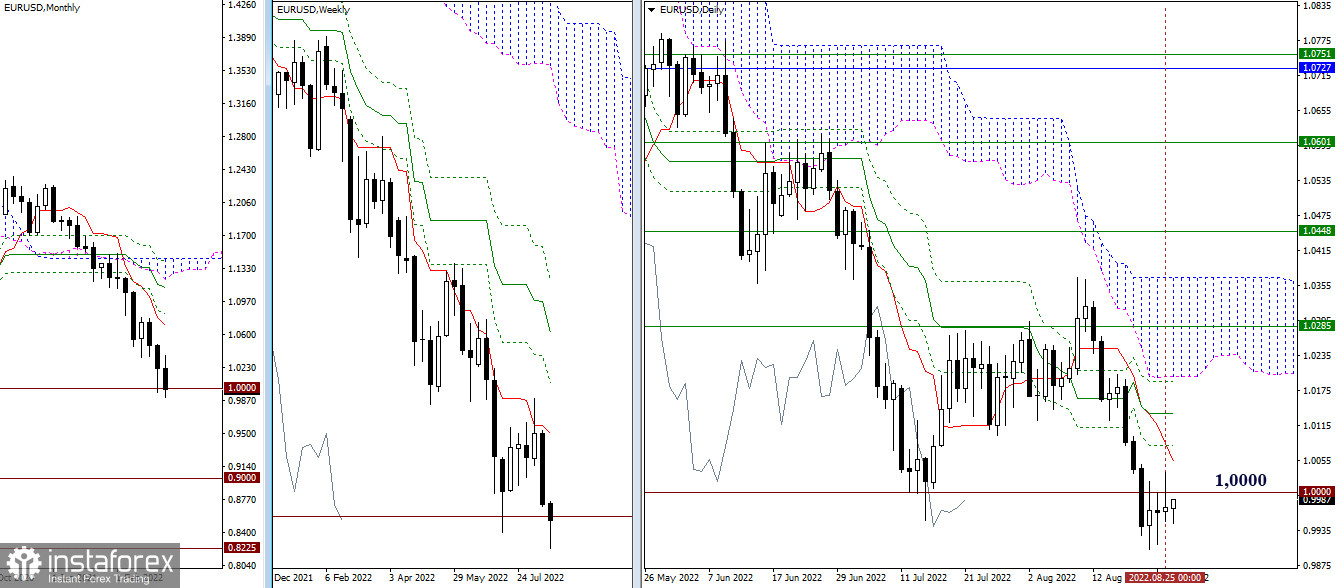
The situation did not change much yesterday as market uncertainty still persists. EUR/USD is consolidating below the 1.0000 level. Traders wonder where the pair will close this week. If the price breaks through the level of 1.0000 on the weekly chart and continues the downtrend (to the lowest extremum point of the current correction - 0.9901) the next downward targets will again become relevant: the psychological level of 0.9000 and the low of 2000 at 0.8225. In case bulls take over and manage to push the price above 1.0000 and settle there, the nearest targets will be the resistance levels of the Ichimoku Cross (1.0052 – 1.0080 – 1.0135 – 1.0190-99).

H4 – H1
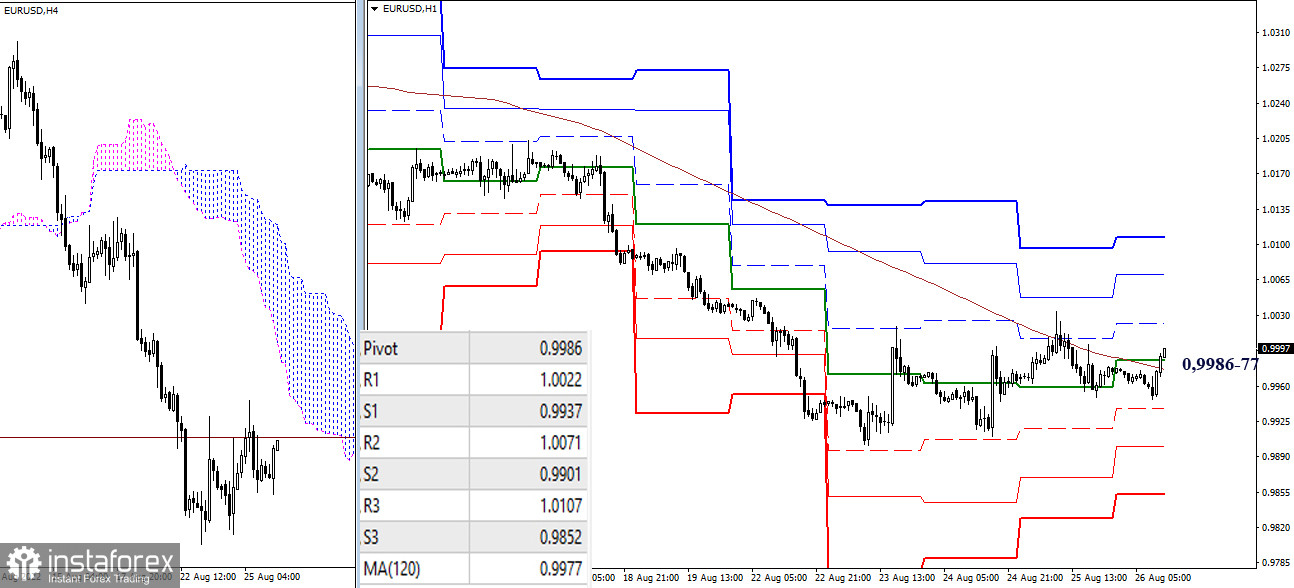
The pair is still going through a correction phase on lower timeframes. Market participants are fighting for the key levels found in the range of 0.9986-77 (central daily pivot level + weekly long-term trend). Additional targets on the intraday chart can be found at resistance (1.0022 – 1.0071 – 1.0107) and support (0.9937 – 0.9901 – 0.9852) levels of the standard pivot points.
***
GBP/USD

Higher timeframes
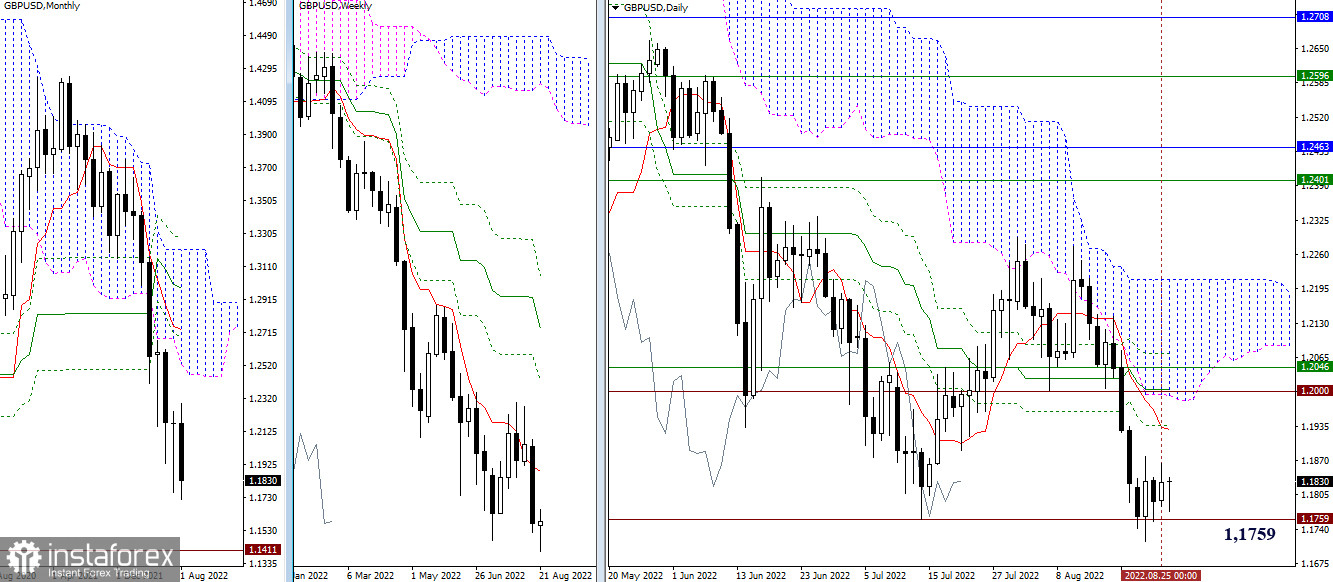
The pair is consolidating at the support level of 1.1759 (previous extremum point). The upward targets are located at the resistance levels found on different timeframes in a wide range of 1.936 – 1.2000 – 1.2046 – 1.2073. If the pair completes consolidation and resumes the downtrend at 1.1716, this can strengthen the bearish bias. The key target in this case will be the level of 1.1411 (the lowest extremum point of 2020).

H4 – H1
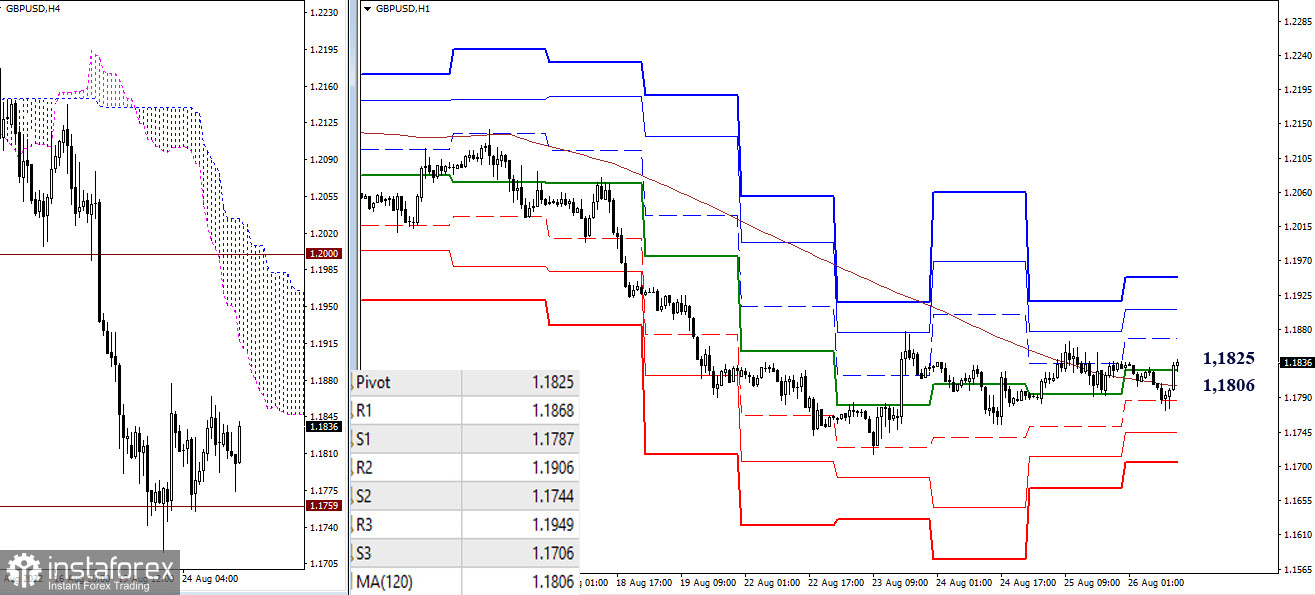
The uncertainty of higher timeframes can also be seen in shorter time intervals. Market participants have been fighting for the key levels for quite some time. Today, the key levels are found in the area of 1.1806 – 1.1825 (central pivot point + weekly long-term trend). Trading above these levels favors the bulls. In case of an uptrend, the upward targets are seen at 1.1868 – 1.1906 – 1.1949 (resistance of standard pivot levels). Consolidating and trading below the zone of 1.1806 – 1.1825) will support bear traders. Additional downside targets can be found at 1.1716 (lowest extremum point) and 1.1744 – 1.1706 (support of standard pivot levels).
***
Technical analysis is based on:
For higher timeframes – Ichimoku Kinko Hyo (9.26.52) + Fibo Kijun levels
For H1 – Pivot Points (standard) + 120-day Moving Average (weekly long-term trend)
 English
 Русский
 Bahasa Indonesia
 Bahasa Malay
 ไทย
ไทย Español
 Deutsch
 Български
 Français
 Tiếng Việt
 中文
中文 বাংলা
বাংলা हिन्दी
 Čeština
 Українська
 Română

