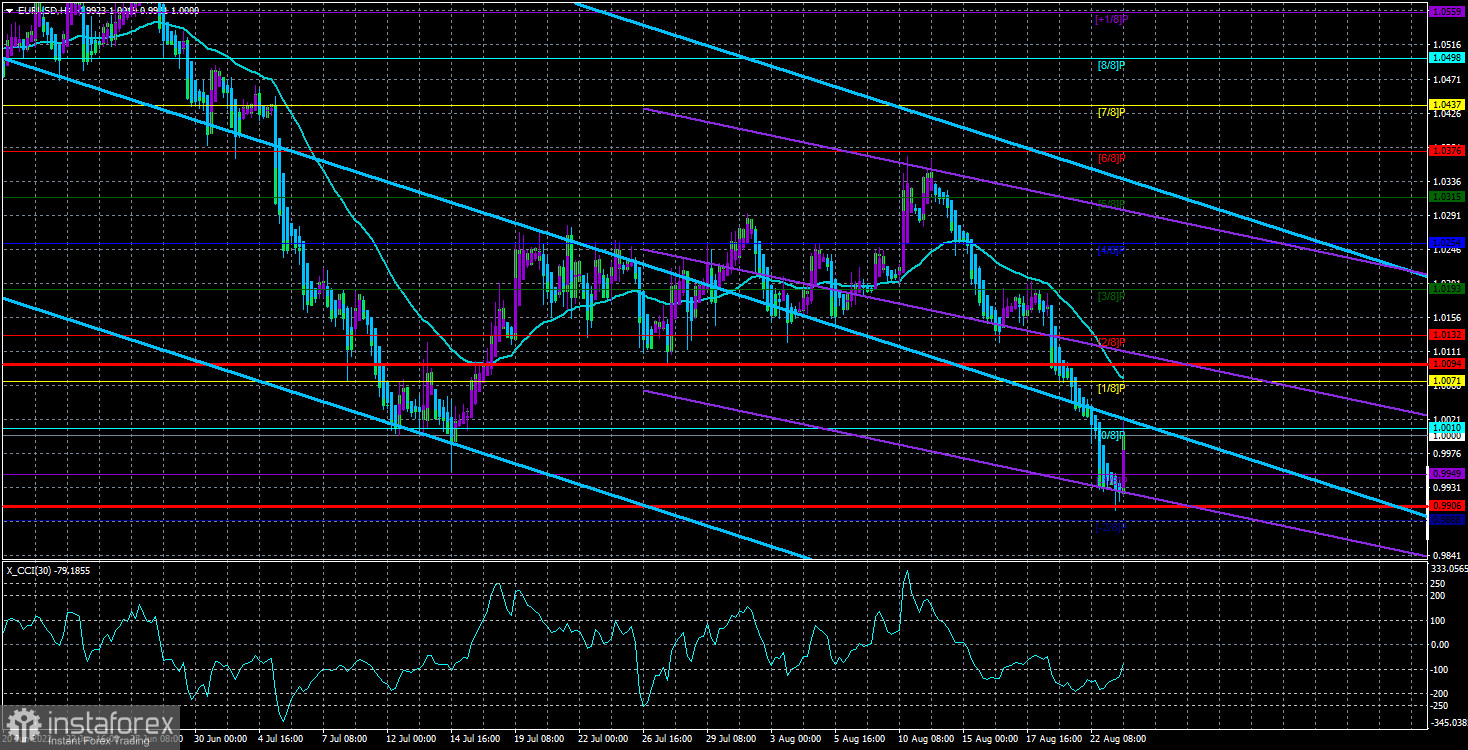
The EUR/USD currency pair easily and naturally worked to the 99th level on Tuesday. The fall has been going on without a single correction for more than a week, and from a technical point of view, everything is logical. Recall that both linear regression channels are currently directed downward. The moving average line is directed downwards, and the price is located below it. At the 24-hour TF, the euro currency could not even overcome the Ichimoku cloud (once again). Thus, after another correction of 400 points within the global downtrend, the pair already had every reason to resume falling. And the fact that it falls almost daily without correction is quite unusual. However, we recall that most factors remain on the side of the dollar, and the market has not been buying it for almost a month. One thing is for sure – the current drop is not related to any specific event or is not related to any report or news.
What can we expect from the pair in the future? In principle, the situation is such that quotes can go down by another 300–400 points completely freely. After all, most of the macroeconomic reports were ignored last week. Therefore, even if traders receive a report favoring the euro currency, this does not mean they will rush to buy euros. We need to wait until the fuse of the bears runs out by itself. This moment may not coincide with macroeconomic publications or a fundamental event.
The dollar does not need the support of Jerome Powell
The fundamental event this week will be the only one. Jerome Powell is scheduled to speak at the economic symposium on Friday. Many are waiting for new revelations from him, but it makes no sense from our point of view. Now everything depends on the next inflation report. If the consumer price index continues to slow down significantly, the Fed will be able to soften its aggressive monetary policy. If not, we will have to raise the rate by 0.75% again since there is still a long way to go from the current value to the target. There is no need to believe that the rate of 2.5% or even 3% will be able to return inflation to 2%. Thus, Powell on Friday can only announce the full commitment of the Fed to its main goal for 2022-2023. Namely, the reduction of inflation to 2%. He will probably say that the regulator will continue to be ready to raise the key rate at any pace. Still, at the same time, it will carefully study all the statistical data to adjust its monetary approach in time. There will be no specifics and a clear phrase, "we will raise the rate in September by 0.75%."
As you can see, the US currency is in great demand at this time, so it does not need a "foundation" to continue its growth. Powell will speak late Friday, a few hours before the market closes for the weekend. If there is any reaction, it will follow on Monday. Even if it is on Friday, it is unlikely to work out since it is bad practice to open deals at the close of the market. Well, during the current week, the dollar may well continue to grow. The correction will begin sooner or later, and it can be identified by the Heiken Ashi indicator or by fixing the price above the moving average line. Technology is now almost the main assistant of traders because there are practically no fundamental events planned for this week, and traders cheerfully ignore macroeconomic data.

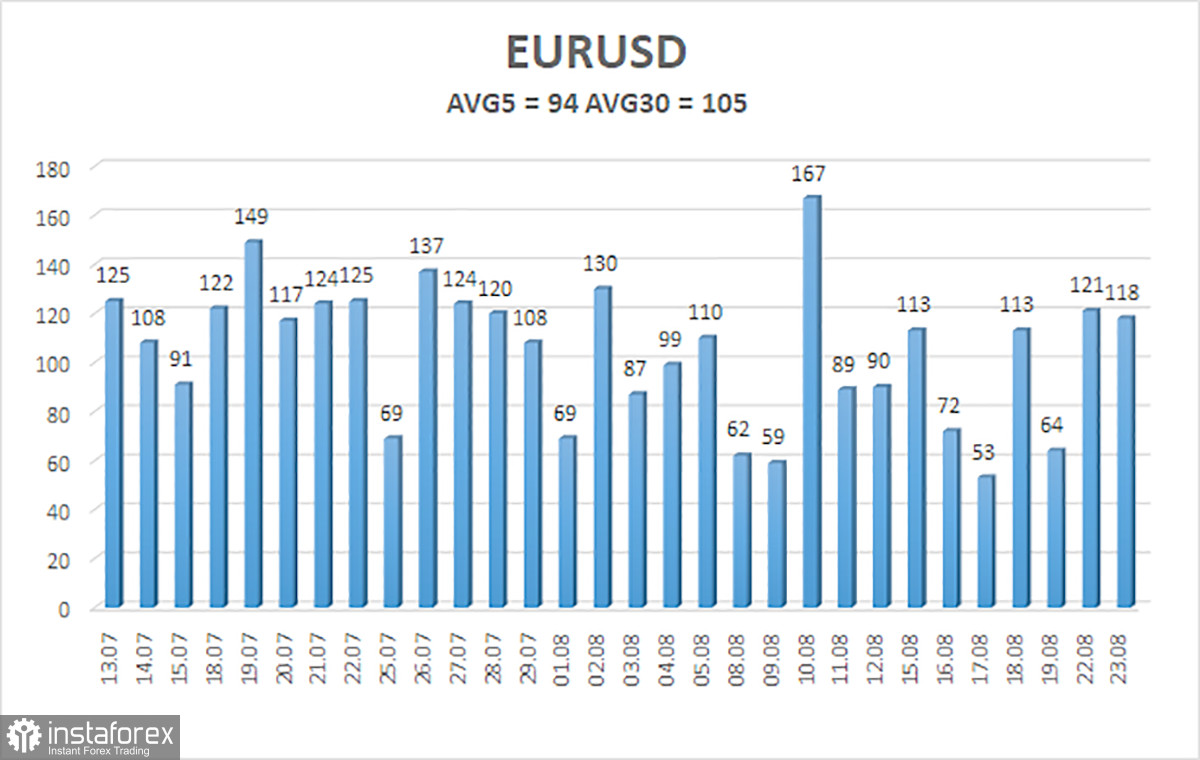
The average volatility of the euro/dollar currency pair over the last five trading days as of August 24 is 94 points, which is characterized as average. Thus, we expect the pair to move today between the levels of 0.9906 and 1.0094. The reversal of the Heiken Ashi indicator downwards signals the resumption of the downward movement.
Nearest support levels:
S1 – 0.9949;
S2 – 0.9888.
Nearest resistance levels:
R1 – 1.0010;
R2 – 1.0071;
R3 – 1.0132.
Trading Recommendations:
The EUR/USD pair has started to adjust. Thus, we should now consider new short positions with targets of 0.9949 and 0.9906 in the case of a reversal of the Heiken Ashi indicator. It will be possible to consider long positions after fixing the price above the moving average with targets of 1.0132 and 1.0193.
Explanations of the illustrations:
Linear regression channels – help to determine the current trend. If both are directed in the same direction, it means that the trend is now strong;
Moving average line (settings 20.0, smoothed) – determines the short-term trend and the direction in which to trade now;
Murray Levels – target levels for movements and corrections;
Volatility levels (red lines) are the likely price channel in which the pair will spend the next day, based on current volatility indicators;
The CCI indicator – its entry into the oversold area (below -250) or into the overbought area (above +250) means that a trend reversal in the opposite direction is approaching.
 English
 Русский
 Bahasa Indonesia
 Bahasa Malay
 ไทย
ไทย Español
 Deutsch
 Български
 Français
 Tiếng Việt
 中文
中文 বাংলা
বাংলা हिन्दी
 Čeština
 Українська
 Română

