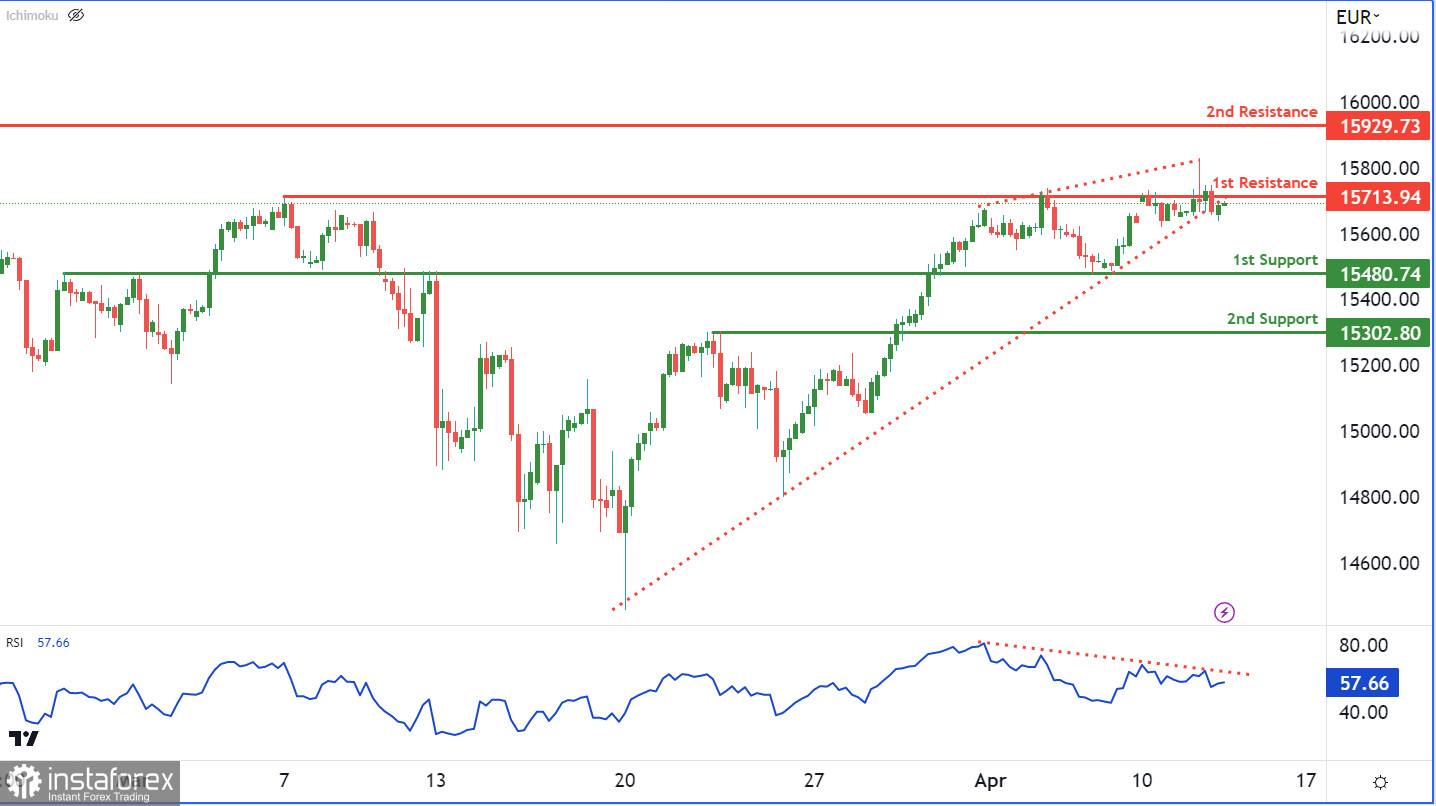
The GER30 chart is currently indicating a bearish momentum, as it has broken below an ascending support line. This indicates that we may see further price declines in the near future.
If the price reacts bearishly, it could drop towards the 1st support level of 15480.74, after potentially being rejected at the 1st resistance level of 15713.94. The 1st support level has acted as a strong level of support in the past, as it is an overlap support level that has held the price multiple times. In addition, the 2nd support level is at 15302.80, which is a pullback support level and could also provide support if the price continues to drop.
On the resistance side, we have the 1st resistance level at 15713.94, which is a multi-swing high resistance level. This level has proven to be a challenge for the price to break through in the past. The 2nd resistance level is at 15929.73, which is a swing high resistance level.
Furthermore, the RSI is displaying bearish divergence versus price, indicating that a reversal may occur soon. This could potentially reinforce the bearish momentum seen on the GER30 chart.
 English
 Русский
 Bahasa Indonesia
 Bahasa Malay
 ไทย
ไทย Español
 Deutsch
 Български
 Français
 Tiếng Việt
 中文
中文 বাংলা
বাংলা हिन्दी
 Čeština
 Українська
 Română

