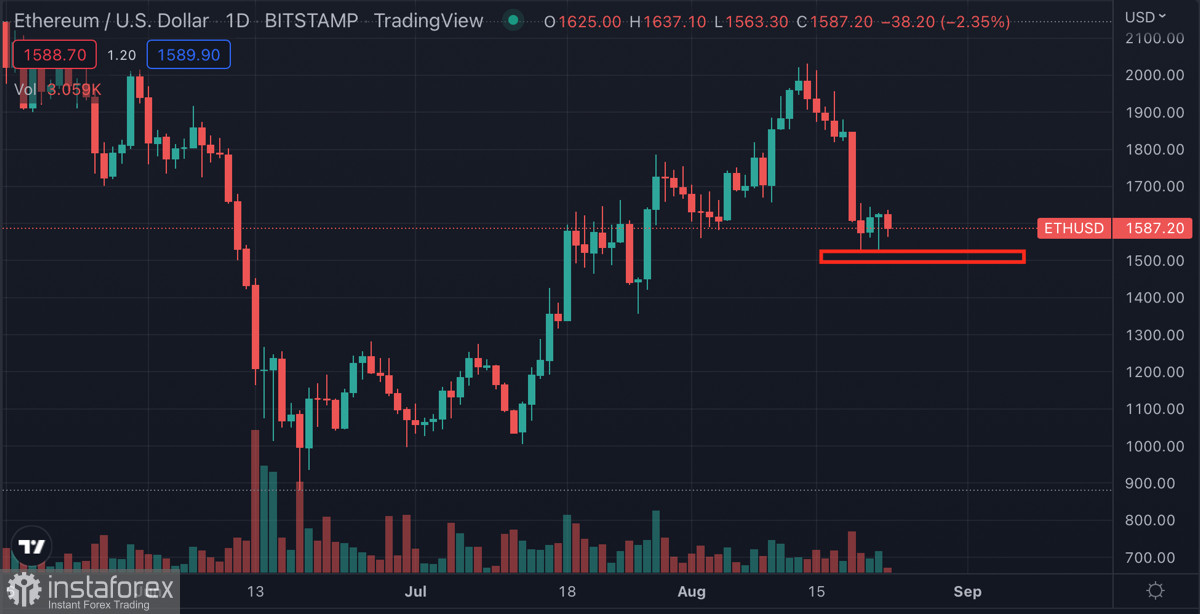
The news of the onset of the second wave of the bear market and the decline in cryptocurrency quotes is further shocking. Investment and network activity of Ethereum, the main catalyst for liquidity inflows to the cryptocurrency market, is declining like the performance of other coins. Taking into account altcoin's special status, pessimistic metrics are alarming for the market. The asset has ceased its downward movement and has consolidated near the $1,550 support level. According to the data of the cryptocurrency's price movement, there is every reason to believe that ether's decline will continue.
It should be noted that Ethereum's correction may be protracted from a technical perspective without taking into account fundamental factors. Moreover, the weekly chart of the asset shows that ether forms six or seven bullish candles during an upward movement. Subsequently, the price reaches a certain limit and the asset begins to decline. An identical situation occurred with ether in the current upward movement. Now let's focus on the depth of the corrective movement of each of the bullish rallies, which consisted of six or seven candles.
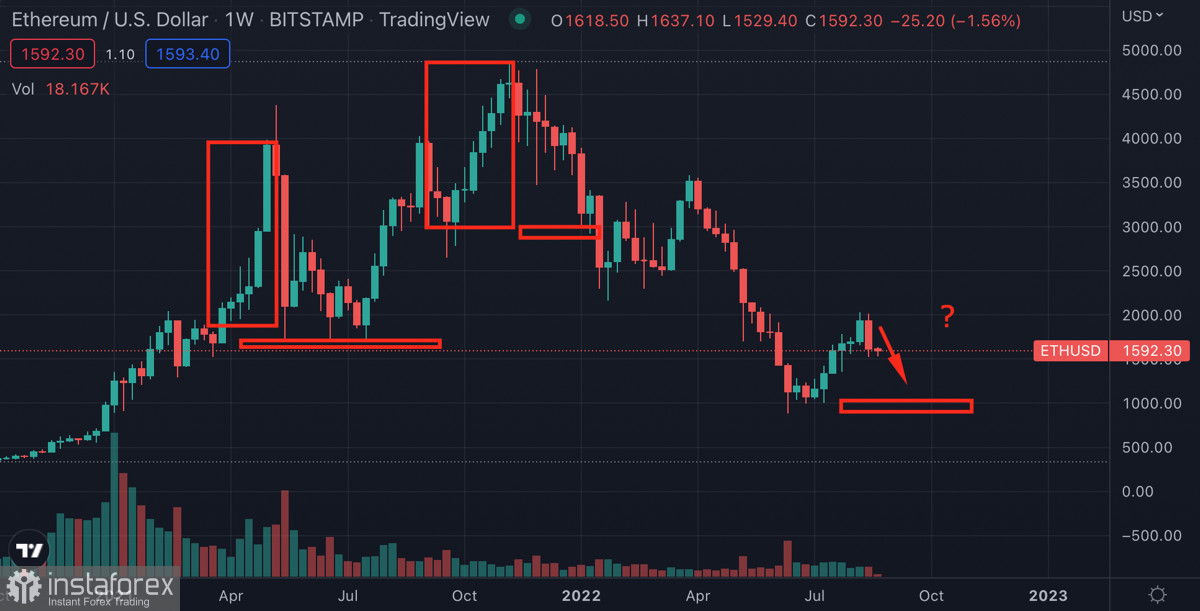
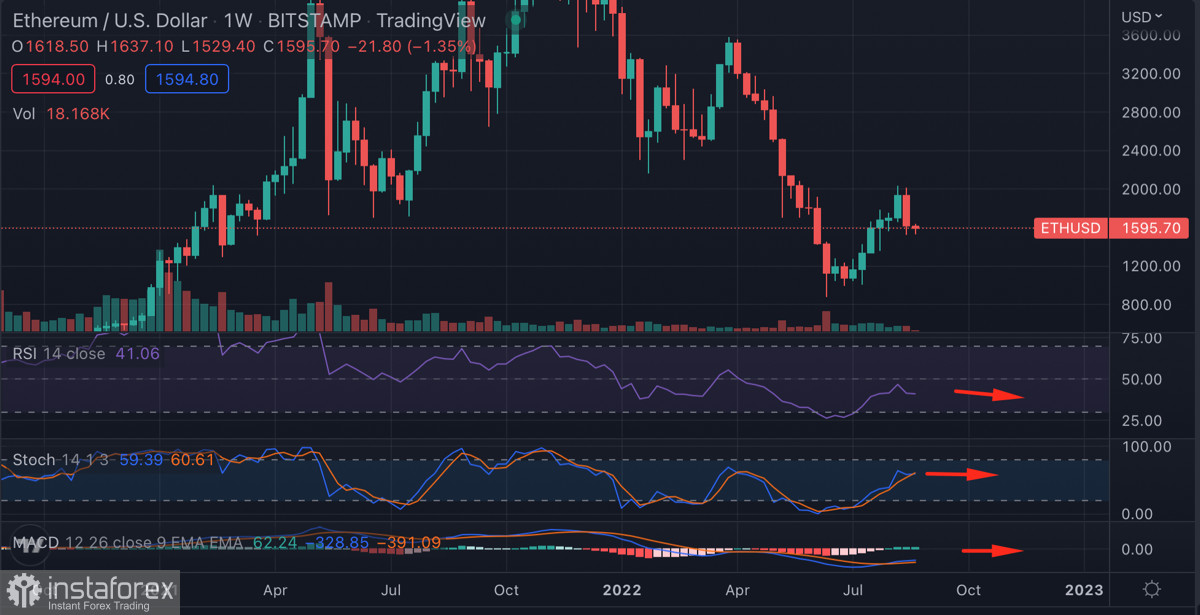
According to the weekly chart, ETH quotes inevitably returned to the level of the uptrend formation after reaching the high. As for Ethereum, the level around $1,000 should be considered the starting point. Technical indicators of the asset show a certain break in the usual price movement on the weekly chart. The stochastic oscillator was moving northward. However, it later formed a bearish crossover and is going to fall below the 40 level. A similar situation occurred with the RSI and MACD where bearish volumes contributed to the declines.
The situation does not change dramatically on the daily chart. Ethereum is in a strong support zone near the $1,550 level. However, the fact that the price gradually starts to test the large-scale support area of $1,430-$1,550 is alarming. If the price breaks through this boundary downwards, it will dramatically fall to the final range of $1,000-$1,200. Technical indicators signal bullish attempts to stabilize the situation. Apparently, bullish impulses are being absorbed by bearish volumes. A stochastic oscillator tried to make an upward reversal. However, it eventually came under sellers' pressure and formed another bearish cross near the oversold level. The relative strength index also began to decline after a local attempt to resume the flat movement.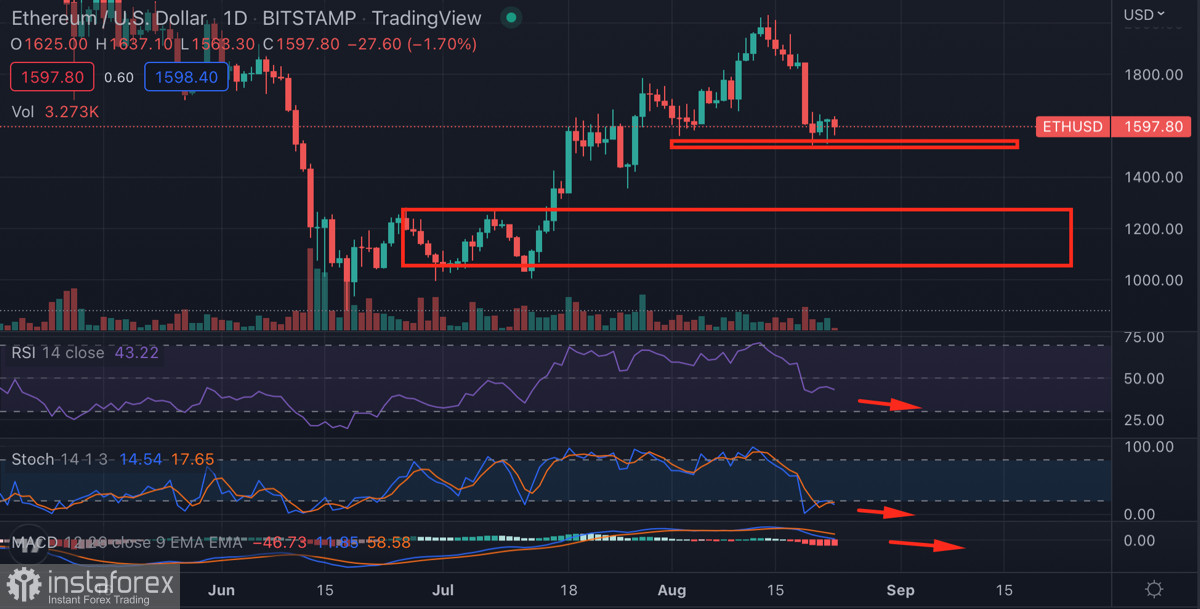
Ether's on-chain metrics also show a bearish dynamic. The total number of unique addresses does not see a significant influx of new users. At the same time, there were local spikes of activity, which can be attributed to short-term interest due to significant events. Trading volumes remained unchanged and did not show any upward movement. Taking into account bullish impulses and price growth, a weak trading volume indicator signals a lack of fundamental interest in the asset.
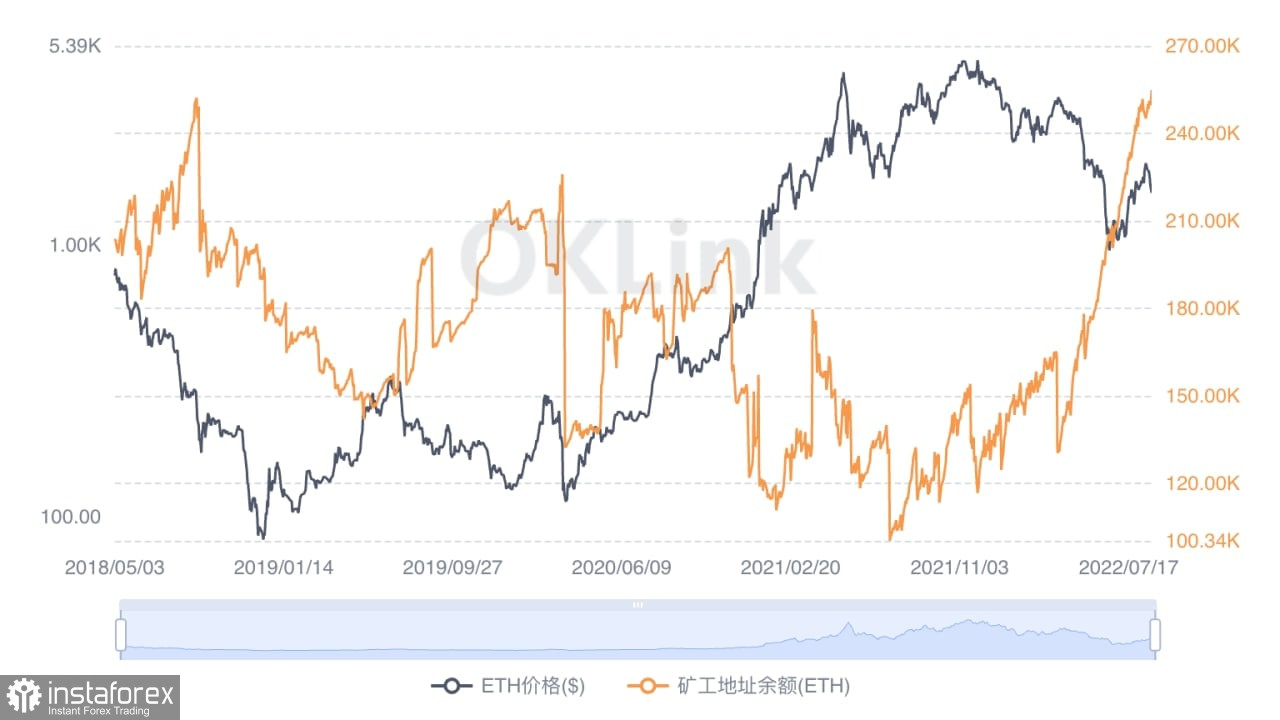
Despite a rapid decline in interest and trading activity, Ethereum remains the major catalyst for growth in the crypto market. The current correction will likely last until the end of this week due to the correlation between Bitcoin and the rising US dollar index. At the same time, ETH is massively holding its coins. According to OKLink, Ethereum miners' balance has reached a three-year high. The situation is similar for retail and institutional investors. The DXY correction was the most profitable for ether. Currently, it awaits an uptrend in September.
 English
 Русский
 Bahasa Indonesia
 Bahasa Malay
 ไทย
ไทย Español
 Deutsch
 Български
 Français
 Tiếng Việt
 中文
中文 বাংলা
বাংলা हिन्दी
 Čeština
 Українська
 Română

