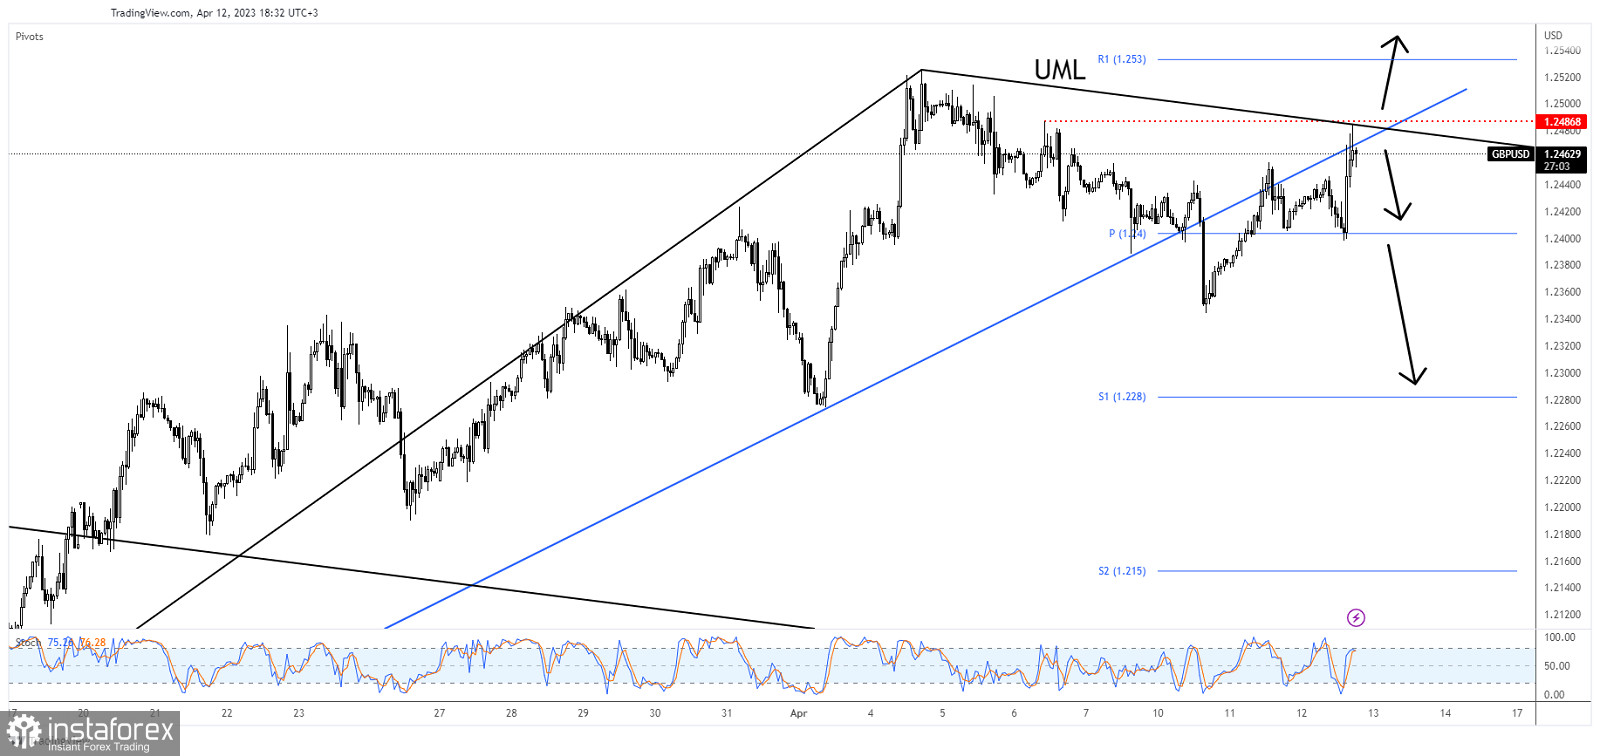
The GBP/USD pair rallied in the short term as the US reported lower inflation today. The bias is bullish, so a new upside movement was natural. In the short term, it has dropped a little but the sell-off was only temporary. GBP/USD is trading at 1.2463 below today's high of 1.2484.
Fundamentally, the USD took a hit from the US inflation figures. The Consumer Price Index increased only by 0.1% versus the 0.2% growth expected and compared to the 0.4% growth in the previous reporting period, CPI y/y reported a 5.0% growth versus the 5.1% growth expected, while Core CPI registered a 0.4% in March growth as expected but less compared to the 0.5% growth in February. Tonight, the FOMC Meeting Minutes should be decisive.
GBP/USD Under Strong Upside Pressure!

As you can see on the H1 chart, the rate is challenging the uptrend line. The descending pitchfork's upper median line (uml) and 1.2486 represent upside obstacles as well. As long as the price stays above the weekly pivot point of 1.24, the currency pair could try to extend its growth.
It remains to see how it will respond to the FOMC Meeting Minutes. A dovish rhetoric could weaken the greenback.
GBP/USD Forecast!
A valid breakout through the upper median line (UML) and through 1.2486 activates further growth and is seen as a bullish signal.
On the contrary, false breakouts through the resistance levels may announce a new sell-off. Still, only a new lower low, a valid breakdown below 1.2400 brings new short opportunities.
 English
 Русский
 Bahasa Indonesia
 Bahasa Malay
 ไทย
ไทย Español
 Deutsch
 Български
 Français
 Tiếng Việt
 中文
中文 বাংলা
বাংলা हिन्दी
 Čeština
 Українська
 Română

