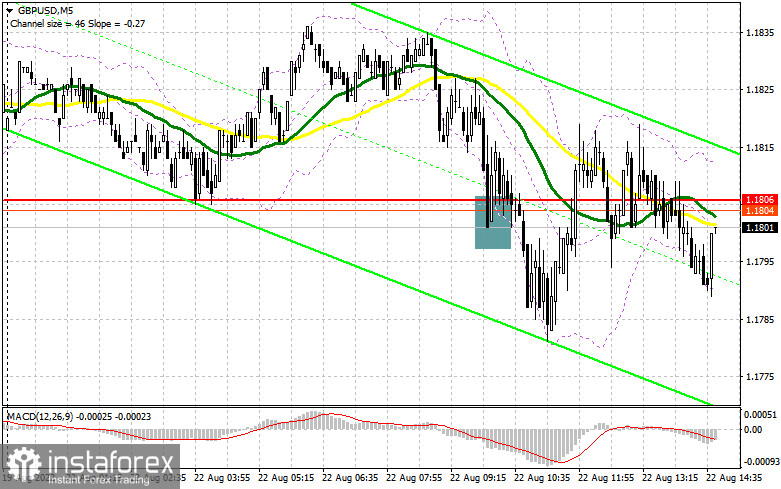
In my morning forecast, I paid attention to the level of 1.1806 and recommended making decisions on entering the market. Let's look at the 5-minute chart and figure out what happened there. A false breakdown in the area of 1.1806 at the very beginning of the day signaled to buy the pound, which, unfortunately, did not materialize. I didn't see any upward movement, after which trading continued around 1.1806. It completely negated the upward potential of the pair, even at the beginning of this week. In the afternoon, the technical picture was completely revised.

To open long positions on GBP/USD, you need:
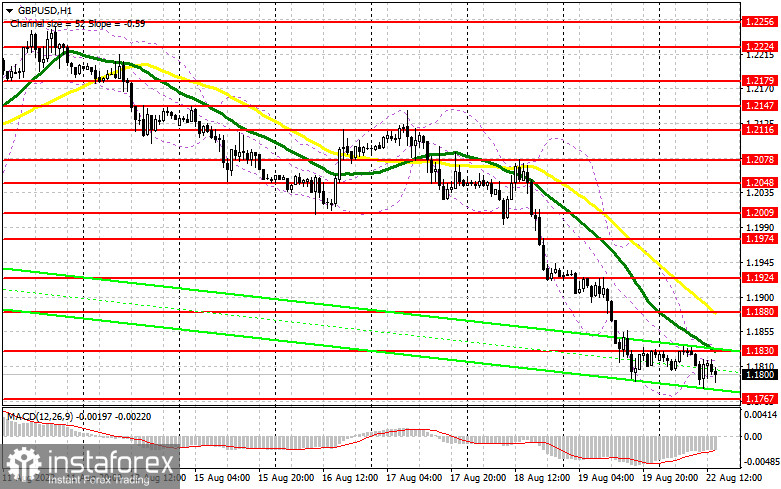
The bearish trend persists for the pound, and catching lows or bounces will be the correct decision. Several technical indicators have recovered from the oversold area, and the pair has not shown any upward correction. It suggests that very few people are still willing to buy the pound, and it is best to bet on a further fall in GBP/USD. In the case of a decline, only the formation of a false breakdown near the new level of 1.1767 forms a buy signal to restore to the area of 1.1825, just above which the moving averages are playing on the side of the bears. A breakdown and a reverse test from the top down of this range against the background of the absence of important fundamental statistics for the United States and the report on the national activity index of the Federal Reserve Bank of Chicago can hardly be considered as such, will open the way to 1.1880. A more distant goal would be a maximum of 1.1924, where I recommend fixing the profits. If GBP/USD falls and there are no buyers at 1.1767, the downward trend will continue. In this case, I advise you not to rush purchasing. Only a false breakdown near the next monthly low of 1.1707 will give a new signal. It is possible to open long positions on GBP/USD immediately for a rebound from 1.1643 or even lower – around 1.1573 with the aim of a correction of 30–35 points within a day.
To open short positions on GBP/USD, you need:
In the second half of the day, there are no fundamental statistics on the United States, so buyers of the US dollar have nothing to count on other than a strong trend. Protecting the 1.1825 level will be a priority in case of an upward correction. A false breakdown at 1.1825 will provide sellers of the pound with new strength, allowing them to count on a downward movement to the 1.1767 area and a breakthrough of this range. The reverse test from the bottom up of 1.1767 will give an entry point for sale with the prospect of reaching 1.1707, which is very close to the new annual minimum of 1.1643. The farthest target will be the 1.1573 area. With the option of GBP/USD growth and the absence of bears at 1.1825, the bulls will have a real chance of correction. In this case, I advise you not to rush with sales: only a false breakdown in the area of 1.1880 will give an entry point to short positions in the expectation of a rebound of the pair. I advise you to open short positions immediately for a rebound based on the pair's movement down by 30-35 points within the day from the resistance of 1.1924.

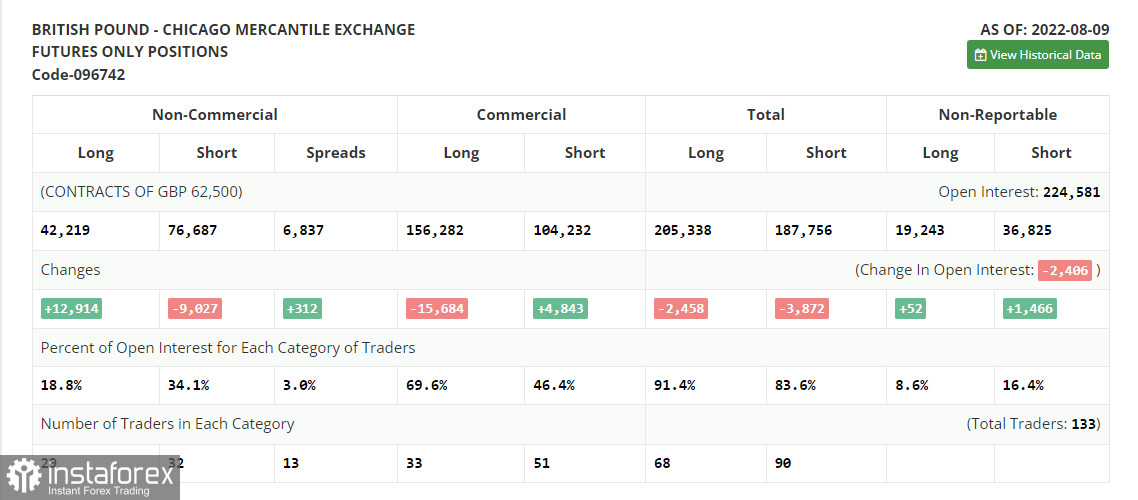
The COT report (Commitment of Traders) for August 9 recorded a reduction in short positions and an increase in long positions, which led to a decrease in the negative delta. And although a less active reduction in UK GDP in the 2nd quarter of this year will allow us to expect that the economy will survive this crisis more steadily, households do not have to pay less on bills, which only exacerbates the cost-of-living crisis in the country. The talk that by the end of this year, the UK economy will slip into recession also does not give confidence to traders and investors. Do not forget how the GBP/USD pair is affected by the decisions of the Federal Reserve System. Last week, it became known that inflation in the United States slowed down slightly – this is a good reason to look towards risky assets, but it is unlikely that this will lead to an increase in the bullish trend for the same pound. We will most likely remain within a wide side channel until the end of the month since we hardly have yet to count on updates to monthly highs. The COT report indicates that long non-commercial positions increased by 12,914 to 42,219. In contrast, short non-commercial positions decreased by 9,027 to the level of 76,687, which led to a reduction in the negative value of the non-commercial net position to the level of -34,468 from the level of -56,409. The weekly closing price decreased to 1.2038 against 1.2180.
- Moving average (moving average determines the current trend by smoothing out volatility and noise). Period 50. The graph is marked in yellow.
- Moving average (moving average determines the current trend by smoothing out volatility and noise). Period 30. The graph is marked in green.
- MACD indicator (Moving Average Convergence / Divergence - moving average convergence/divergence) Fast EMA period 12. Slow EMA period 26. SMA period 9
- Bollinger Bands (Bollinger Bands). Period 20
- Non-profit speculative traders, such as individual traders, hedge funds, and large institutions use the futures market for speculative purposes and to meet certain requirements.
- Long non-commercial positions represent the total long open position of non-commercial traders.
- Short non-commercial positions represent the total short open position of non-commercial traders.
- Total non-commercial net position is the difference between the short and long positions of non-commercial traders.
 English
 Русский
 Bahasa Indonesia
 Bahasa Malay
 ไทย
ไทย Español
 Deutsch
 Български
 Français
 Tiếng Việt
 中文
中文 বাংলা
বাংলা हिन्दी
 Čeština
 Українська
 Română

