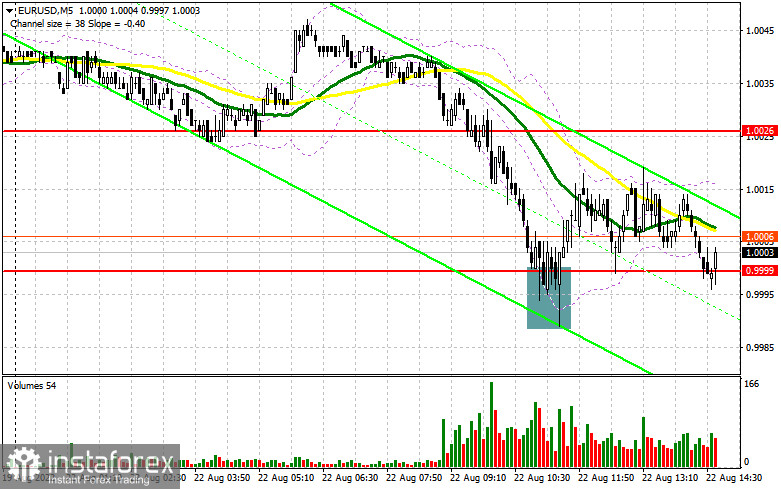
In my morning forecast, I paid attention to the 1.0000 level and recommended making decisions on entering the market. Let's look at the 5-minute chart and figure out what happened there. A new wave of the fall of the euro did not have to wait very long. As a result of the 1.0026 breakdown of the signal to enter the market, I did not wait, so the focus shifted to the 1.0000 level. A false breakdown there led to an excellent entry point, but the rapid growth of the euro did not happen. After an upward correction of 17 points, the price returned to parity again. In the afternoon, the technical picture changed slightly.

To open long positions on EURUSD, you need:
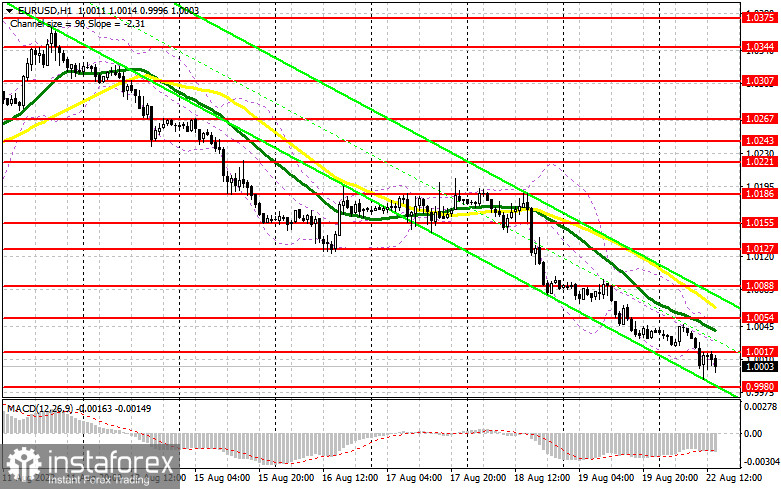
Given that the release of important fundamental statistics is not planned during the American session, it cannot be ruled out that the fall of the euro will continue – the bear market is too strong. In the event of further decline of the pair, only the formation of a false breakdown in the area of the new support of 0.9980 will lead to a signal to open long positions in the hope of restoring the pair with the prospect of updating the nearest resistance of 1.0017, formed by the results of the first half of the day. A breakout and a top-down test of this range from top to bottom will hit the bears' stop orders, forming an additional signal to enter long positions with the possibility of a correction to the area of 1.0054, where the moving averages are playing on the side of the bears' pass. A more distant target will be the resistance of 1.0088, where I recommend fixing the profits. If EUR/USD declines and there are no buyers at 0.9980 in the afternoon, the pressure on the pair will remain. The best option for opening long positions, in this case, will be a false breakdown in the area of the new annual minimum of 0.9948. I advise buying EUR/USD immediately for a rebound only from 0.9915, or even lower – in the area of 0.9886 parity with the aim of an upward correction of 30-35 points within a day.
To open short positions on EURUSD, you need:
The absence of buyers even in the parity area suggests a further fall in the euro. The main task of sellers for the American session remains to protect the intermediate resistance of 1.0017. The optimal scenario for opening short positions will be a false breakdown at this level, leading to the euro's movement down to 0.9980. A breakdown and consolidation below this range will not take long to wait since few people want to go against a new large bear market without sufficient grounds, at least in the form of good fundamental statistics. The reverse test from the bottom up of 0.9980 forms an additional sell signal and a larger pair movement to the area of 0.9948, where I recommend fixing the profits. A more distant target will be the 0.9915 area. In the case of an upward movement of EUR/USD in the afternoon and the absence of bears at 1.0017, the situation may change slightly in favor of buyers who are very much counting on an upward correction. In this case, I advise you to postpone short positions to 1.0054, but only if a false breakdown is formed there. You can sell EUR/USD immediately on a rebound from the maximum of 1.0088, or even higher – from 1.0127 with the aim of a downward correction of 30-35 points.

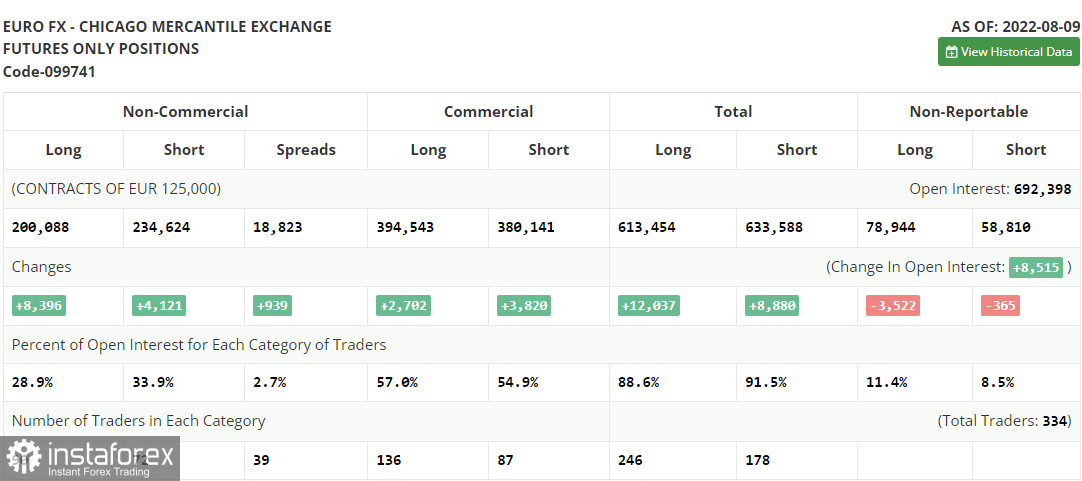
The COT report (Commitment of Traders) for August 9 recorded a sharp increase in both short and long positions. Still, the former turned out to be more, indicating the gradual end of the bear market and an attempt to find the market bottom after reaching the euro parity against the US dollar. Last week, statistics on inflation in the United States were released, which turned everything upside down. The first slowdown in inflationary pressure in recent years has returned to demand for risky assets. But, as you can see on the chart, it was not long. The risk of deteriorating the situation related to the world economic recession discourages traders and investors from building up long positions in the euro. There are no important reports this week that could help the euro regain lost positions, so I recommend betting more on trading in the side channel. Certainly, serious market shocks can hardly be expected before the fall of this year. The COT report indicated that long non-profit positions increased by 8,396 to 200,088, while short non-profit positions jumped by 4,121 to 234,624. At the end of the week, the total non-commercial net position, although it remained negative, rose slightly from -39,811 to -34,536, which indicates a continuation of the market's turn to the side of euro buyers. The weekly closing price rose to 1.0233 from 1.0206.

- Moving average (moving average determines the current trend by smoothing out volatility and noise). Period 50. The graph is marked in yellow.
- Moving average (moving average determines the current trend by smoothing out volatility and noise). Period 30. The graph is marked in green.
- MACD indicator (Moving Average Convergence / Divergence - moving average convergence/divergence) Fast EMA period 12. Slow EMA period 26. SMA period 9
- Bollinger Bands (Bollinger Bands). Period 20
- Non-profit speculative traders, such as individual traders, hedge funds, and large institutions use the futures market for speculative purposes and to meet certain requirements.
- Long non-commercial positions represent the total long open position of non-commercial traders.
- Short non-commercial positions represent the total short open position of non-commercial traders.
- Total non-commercial net position is the difference between the short and long positions of non-commercial traders.
 English
 Русский
 Bahasa Indonesia
 Bahasa Malay
 ไทย
ไทย Español
 Deutsch
 Български
 Français
 Tiếng Việt
 中文
中文 বাংলা
বাংলা हिन्दी
 Čeština
 Українська
 Română

