USD:

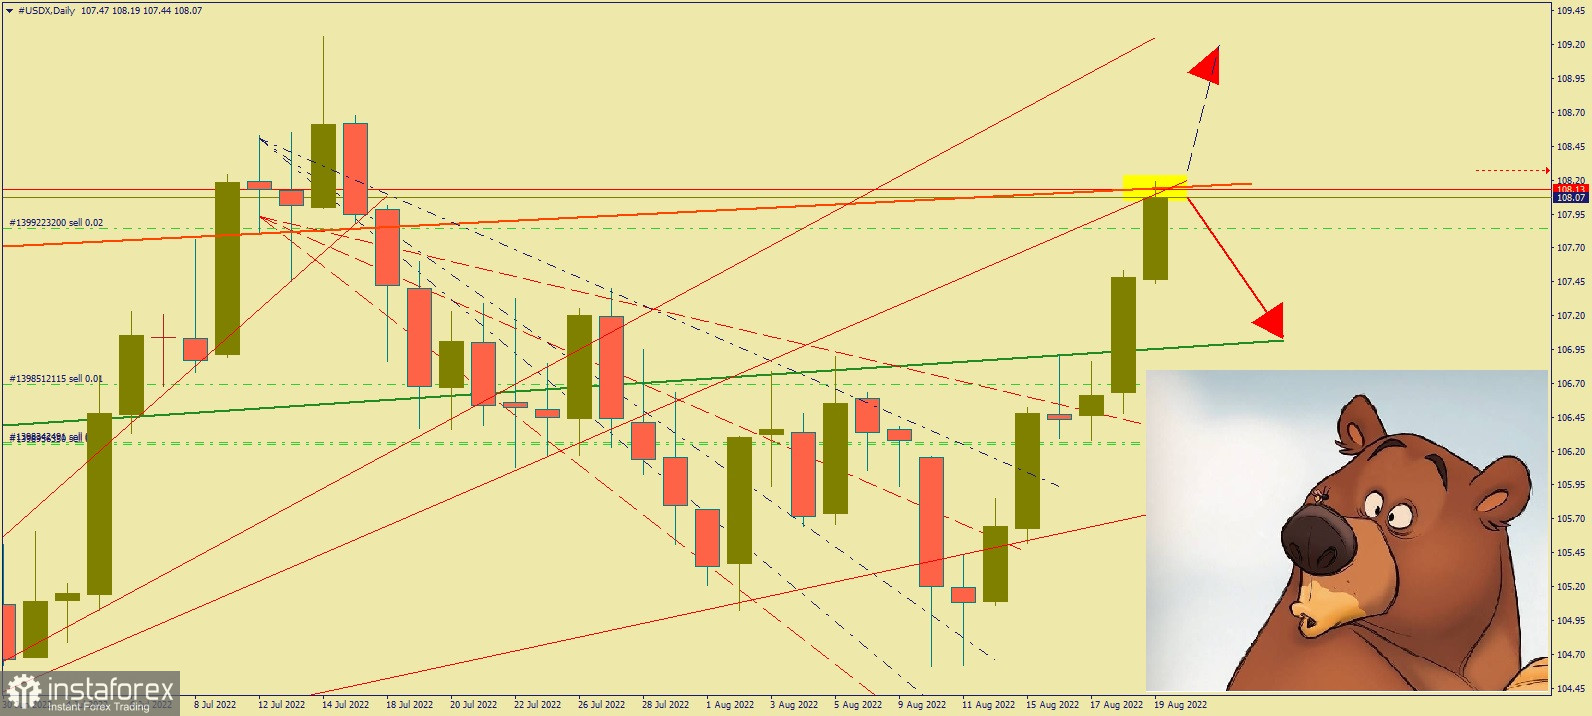
The chart shows the movement of dollar in the daily (D1) chart.
On August 19, #USD reached the support level of 108.10 right after undergoing a strong correction. The level is important as it determines whether the correction is already complete, or if dollar will resume growth.
If the resistance level is very strong, then USD will drop to 107.00. But if 108.00 - 108.10 is broken, it will rise to 09.50 or higher price levels.
Good luck!
 English
 Русский
 Bahasa Indonesia
 Bahasa Malay
 ไทย
ไทย Español
 Deutsch
 Български
 Français
 Tiếng Việt
 中文
中文 বাংলা
বাংলা हिन्दी
 Čeština
 Українська
 Română

