GBP/USD
Analysis:
Quotes of the major of the British pound sterling continue their movement to the "south" of the price field, which began two and a half years ago. The price has come very close to the upper limit of the preliminary target zone. The unfinished section of the main course started on August 10. It has a pronounced impulse character.
Forecast:
A short-term flat is possible at the beginning of the upcoming week. Moreover, an upward vector is not excluded, with an increase in the rate of the resistance zone. It will be followed by a reversal and a resumption of the bearish trend. The greatest activity is likely by the end of the week.
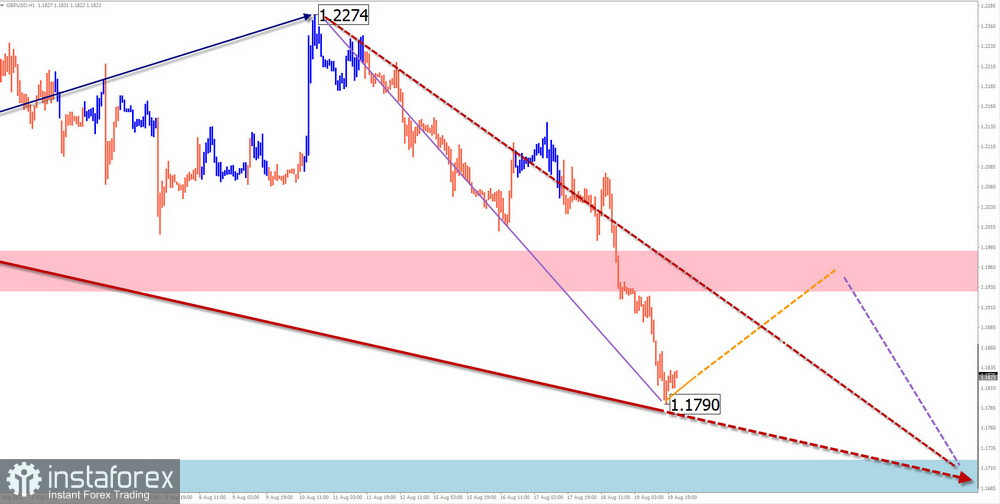
Potential reversal zones
Resistance:
- 1.1930/1.1980
Support:
- 1.1720/1.1670
Recommendations:
Purchases in the British pound market are associated with increased risk and are not recommended. The main attention is proposed to be paid to the search for signals for the sale of the instrument. In these transactions, considering the limited potential of the price move down is worth considering.
AUD/USD
Analysis:
The unfinished section of the main bearish trend of the Australian dollar started on April 5. After the completion of the correction, the final part of the wave (C) began to form on August 11. The calculated support runs along the upper boundary of the preliminary target zone of the entire current trend.
Forecast:
At the beginning of next week, there is a high probability of a short-term price pullback. In the area of the resistance zone, you can expect a change of direction and a resumption of price reduction. The greatest activity can be expected at the end of the week.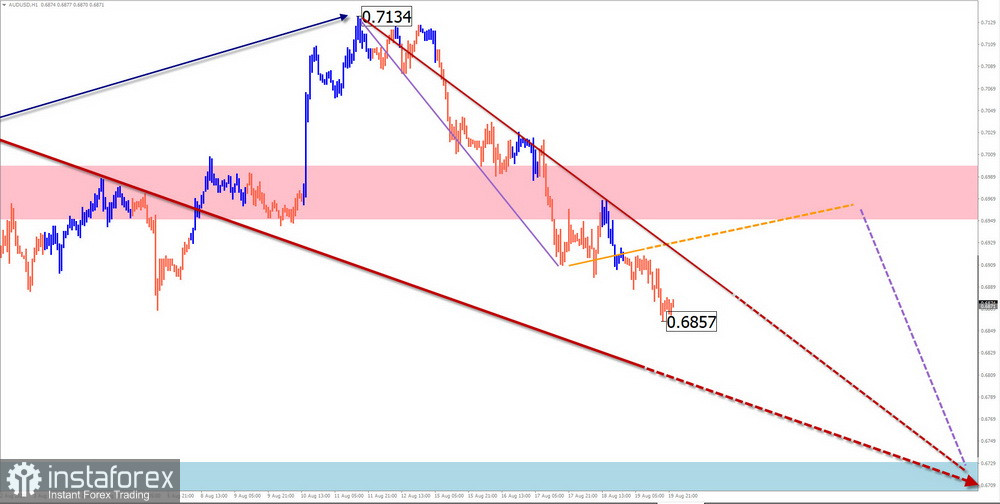
Potential reversal zones
Resistance:
- 0.6960/0.7010
Support:
- 0.6730/0.6680
Recommendations:
Purchases of the "Aussie" in the coming days may lead to losses. It is recommended to refrain from entering the pair's market until the signals for sale appear in the area of the resistance zone.
USD/CHF
Analysis:
Since the beginning of 2021, an uptrend has been developing on the chart of the main Swiss franc pair. Over the past three months, the price has been forming a corrective pennant. By now, its structure has been completed. The wave level of the bullish section from August 11 has reversal potential.
Forecast:
A general upward vector of price movement is expected over the coming week. A short-term "sideways" along the support zone is not excluded in the first days. The greatest activity should be expected by the end of the week. The resistance zone shows the upper limit of the expected weekly move.
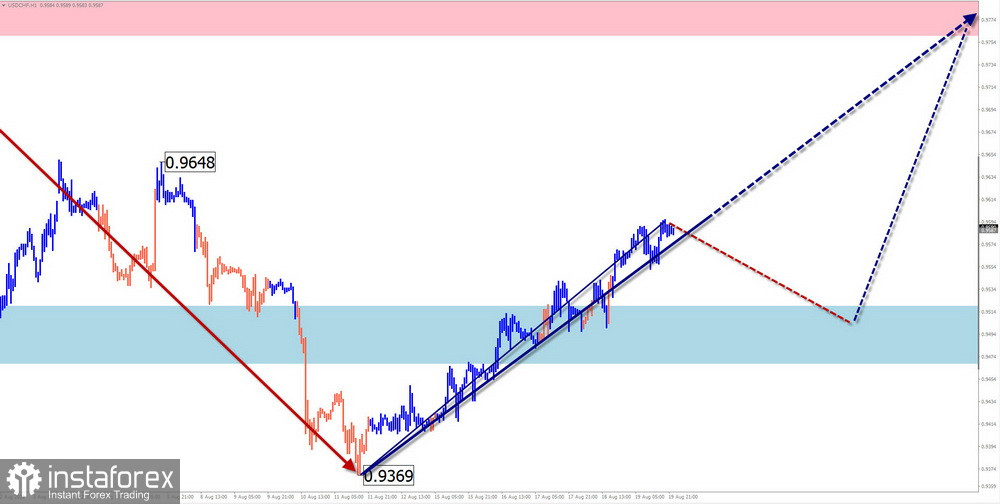
Potential reversal zones
Resistance:
- 0.9760/0.9810
Support:
- 0.9520/0.9470
Recommendations:
In the franc market, pair purchases will be possible in the coming days from the support zone. The resistance zone limits the upward movement potential.
EUR/JPY
Analysis:
The upward trend of the euro cross against the Japanese yen led the pair's quotes to the area of a powerful resistance zone. Since the beginning of summer, the price has been forming a corrective wave in the form of a "descending flag" figure. Its structure at the time of analysis does not show completeness.
Forecast:
In the upcoming weekly period, the pair's quotes are expected to continue moving in the price corridor between the nearest counter zones. At the beginning of the week, a downward trend is more likely, with a decrease in the price to the support zone. The growth rate can be expected closer to the weekend.
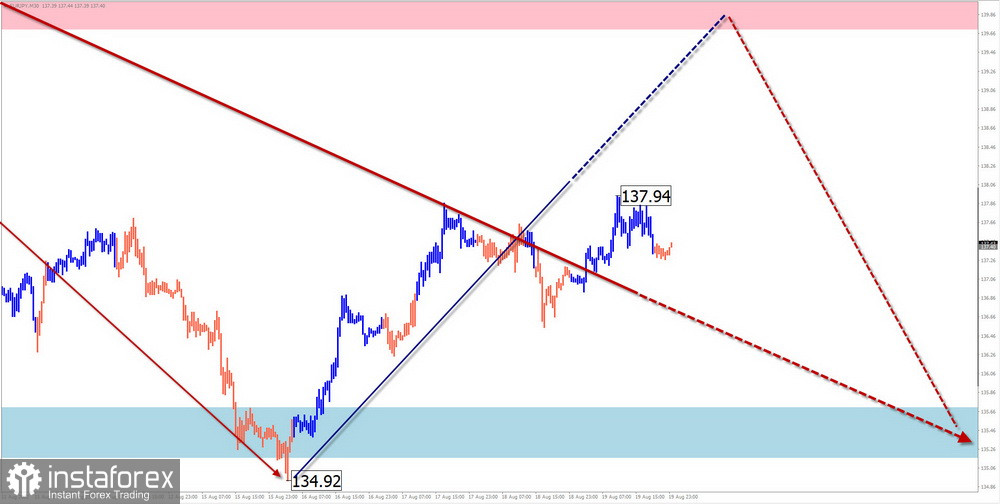
Potential reversal zones
Resistance:
- 139.70/140.20
Support:
- 135.70/135.20
Recommendations:
Short-term trading transactions within separate sessions may become profitable on the pair's market in the coming days. Purchases will become possible after the appearance of reversal signals confirmed by your vehicle in the support area.
US Dollar Index
Analysis:
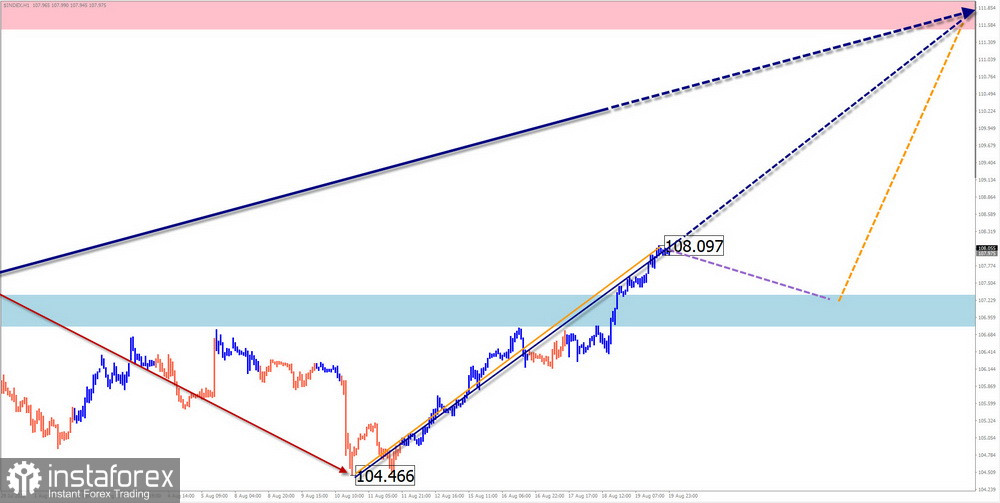
The US dollar continues its upward trend towards the record values of the beginning of the millennium. The unfinished section gives a report on August 10. The nature of its movement is impulsive, and the oncoming sections do not exceed the level of lateral pullback. The wave level of the current section of the chart allows you to classify the movement on a daily scale.
Forecast:
In the first days of the upcoming week, a short-term sideways flat along the calculated support is possible. A new round of activity will follow, with an increase in the values of quotations, up to the calculated resistance.
Potential reversal zones
Resistance:
- 111.50/112.00
Support:
- 107.30/106.80
Recommendations:
In the coming week, the main pairs should bet on the continued weakening of the national currencies. Against the background of a slight weakening of the dollar's position, suitable conditions will be created for entering into transactions.
#Bitcoin
Analysis:
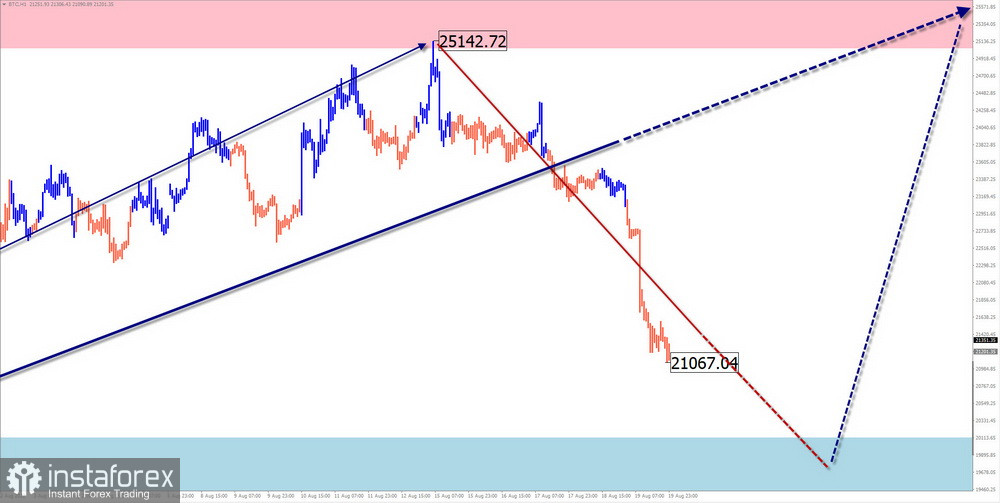
The wave of the downtrend brought bitcoin quotes to the area of powerful support on the largest scale. Since mid-June, the altcoin price has been moving in a narrow price corridor, forming an upward wave. Its wave level exceeds the correction scale of the last section. The middle part (B) has been developing in the structure since the end of July.
Forecast:
The general downward movement vector is expected to continue in the coming days. The decline is likely up to the support zone. Then you can count on the transition to the lateral plane, with the formation of conditions for a reversal. A change, of course, is possible at the end of the week or in the subsequent period.
Potential reversal zones
Resistance:
- 25000.0/26000.0
Support:
- 20100.0/19100.0
Recommendations:
When selling bitcoin, the limited potential for price reduction is worth considering. Purchases will become possible after the signals confirmed by your trading systems appear in the area of the support zone.
Explanations: In simplified wave analysis (UVA), all waves consist of 3 parts (A-B-C). For each TF, only the last incomplete wave is analyzed. The solid background of the arrows shows the formed structure, and the dotted one shows the expected movements.
Attention: The wave algorithm used for the analysis does not consider the duration of the movements of the instruments in time!
 English
 Русский
 Bahasa Indonesia
 Bahasa Malay
 ไทย
ไทย Español
 Deutsch
 Български
 Français
 Tiếng Việt
 中文
中文 বাংলা
বাংলা हिन्दी
 Čeština
 Українська
 Română

