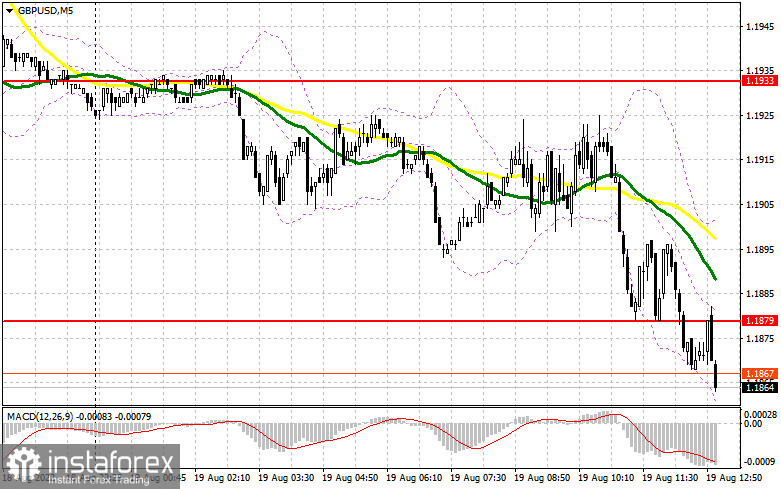
In the morning, the focus was on 1.1879, with entry points considered from this level. Let's look at the 5-minute chart to get a picture of what happened in the market. The pair approached this level a few times, but no buy signal came due to the lack of a false breakout. A sell signal was made when the price broke and retested the mark of 1.1879. The situation changed in the second half of the day.

When to go long on GBP/USD:
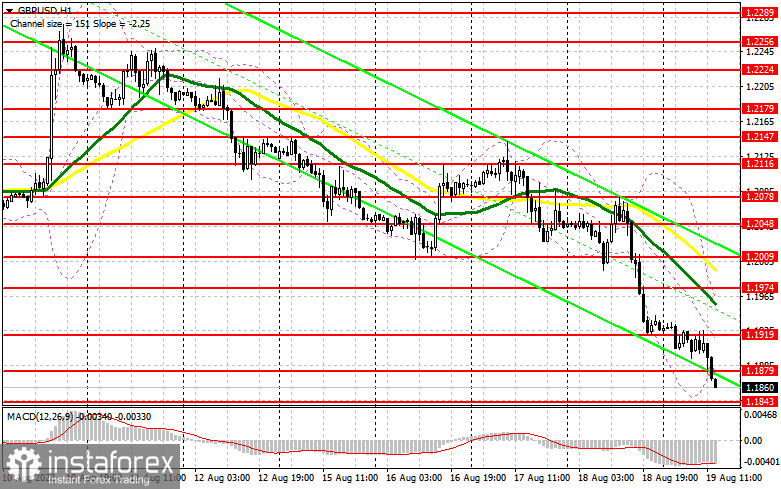
The pound is still bearish. Today is the last trading day of the week. Since Monday, the currency has lost enough, so it is a nice opportunity to consider locking in profits. In the second half of the day, a small bullish correction could occur if bulls manage to defend 1.1843 support. A buy signal could be made after a false breakout, with a target at 1.1879. The price could go to 1.1919 or even head towards a more distant target of 1.1974, in line with bearish MAs, if it breaks through the range and tests it from top to bottom. Profit taking should be considered at around 1.1974. Should GBP/USD fall with no bullish activity at 1.1843, it will be possible to look for long entry points after a false breakout through the 1.1806 low. Long positions could also be opened on a bounce from 1.1762 or 1.1707, allowing a 30-35 pips intraday correction.
When to go short on GBP/USD:
No macro events are scheduled for the second half of the day today. Therefore, the greenback could strengthen. In case of a bullish correction, bears should defend 1.1879. In fact, they have already reached a new monthly low today. The pound could fall and break through the 1.1843 level after a false breakout through 1.1879. A bottom-top retest of the 1.1843 mark will create an additional sell entry point, with a target at 1.1762. The most distant target will stand at 1.1707. If GBP/USD shows growth and there is no bearish activity at 1.1879, a bullish correction could occur. In such a case, short positions could be opened after a false breakout through 1.1919 or on a bounce from 1.1974 resistance, allowing a 30-35 pips downward correction intraday.

Commitments of Traders:
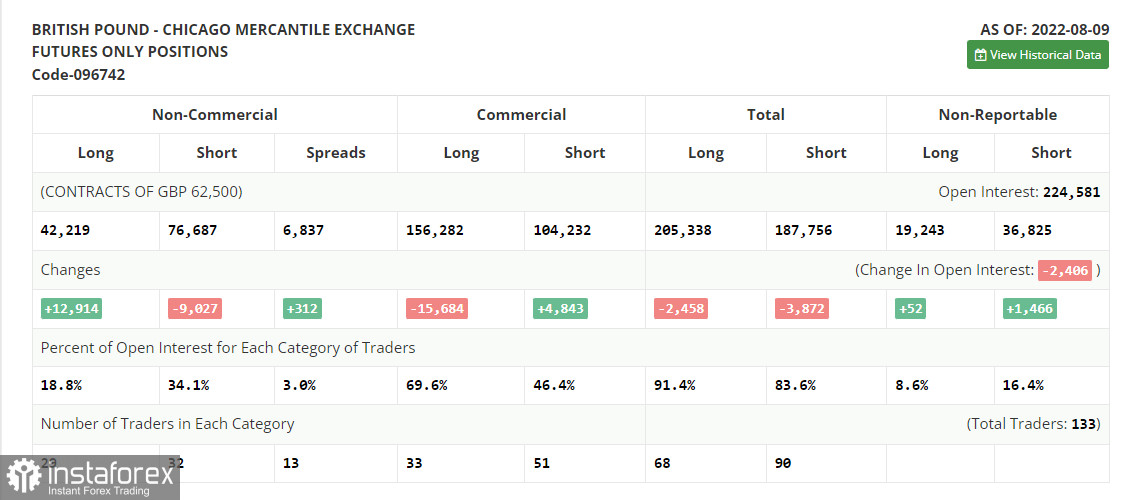
The COT report for August 9 logged a fall in short positions and an increase in long ones, which led to an increase in the value of the negative delta. A smaller contraction in Q2 UK GDP indicates that the economy is dealing with the crisis steadily. However, this fact does not mean that households pay less for utility bills, which only exacerbates the cost-of-living crisis in the country. Concerns are growing that the UK economy might slip into a recession by the end of the year. In addition, the US Federal Reserve's interest rate decisions are weighing on GBP/USD. Last week, the US reported a slowdown in its inflation rate, which is a positive factor for risk assets. Still, it is not enough for the pound to strengthen. The pair is highly likely to trade within a wide sideways channel until the end of the month, and the price will hardly reach new monthly highs during this time. According to the COT report, long non-commercial positions rose by 12,914 to 42,219, while short non-commercial positions fell by 9,027 to 76,687. As a result, the negative value of the non-commercial net position grew to -34,468 from -56,409. The weekly closing price dropped to 1.2038 from 1.2180.

Indicator signals:
Moving averages
Trading is carried out below the 30-day and 50-day moving averages, indicating the continuation of the bearish trend.
Note: The period and prices of moving averages are viewed by the author on the hourly chart and differ from the general definition of classic daily moving averages on the daily chart.
Bollinger Bands
Resistance is seen at around 1.1975, in line with the upper band.
Indicator description:
- Moving average (MA) determines the current trend by smoothing volatility and noise. Period 50. Colored yellow on the chart.
- Moving average (MA) determines the current trend by smoothing volatility and noise. Period 30. Colored green on the chart.
- Moving Average Convergence/Divergence (MACD). Fast EMA 12. Slow EMA 26. SMA 9.
- Bollinger Bands. Period 20
- Non-commercial traders are speculators such as individual traders, hedge funds, and large institutions who use the futures market for speculative purposes and meet certain requirements.
- Long non-commercial positions are the total long position of non-commercial traders.
- Non-commercial short positions are the total short position of non-commercial traders.
- Total non-commercial net position is the difference between short and long positions of non-commercial traders.
 English
 Русский
 Bahasa Indonesia
 Bahasa Malay
 ไทย
ไทย Español
 Deutsch
 Български
 Français
 Tiếng Việt
 中文
中文 বাংলা
বাংলা हिन्दी
 Čeština
 Українська
 Română

