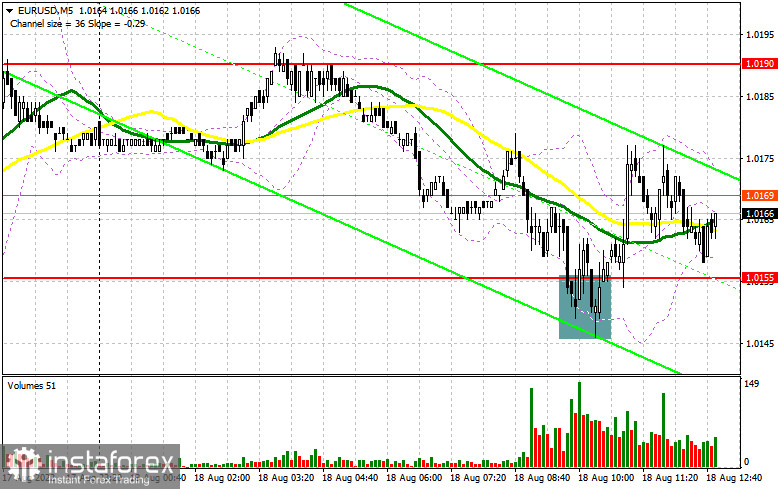
In my morning forecast, I paid attention to the level of 1.0155 and recommended making decisions on entering the market. Let's look at the 5-minute chart and figure out what happened there. The pair's decline in the first half of the day in the area of 1.0155 and a false breakdown at this level led to the formation of a buy signal. As a result, the pair grew by 20 points, but it has not yet been possible to reach the nearest resistance in the area of 1.0190. I will count on the implementation of this scenario in the afternoon. From a technical point of view, nothing has changed, nor has the strategy itself changed.

To open long positions on EURUSD, you need:
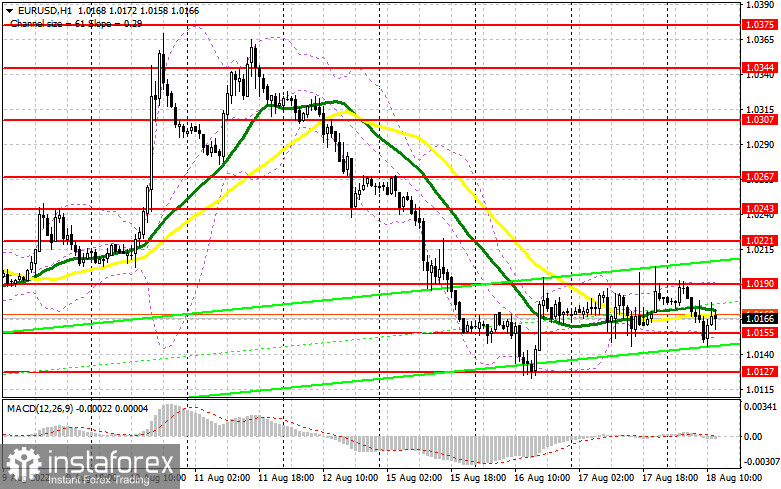
The data on inflation growth rates in the eurozone coincided with economists' forecasts, which did not impress traders, keeping trading within the side channel in which the pair has been since yesterday. Several reports on the US economy are scheduled for the afternoon today: the number of initial applications for unemployment benefits is expected, as well as the Fed-Philadelphia manufacturing index. Weak data may provide some support to the euro in the short term. Still, it should be understood that poor fundamental statistics during the impending economic crisis primarily harm the demand for risky assets and help safe-haven assets, including the US dollar. The report on housing sales volume in the secondary market and the speeches of FOMC members Easter George and Neel Kashkari are unlikely to surprise traders, so I expect the pressure on the pair to remain. In the case of a decline in the pair, only the formation of a false breakdown in the area of 1.0155, by analogy with what I discussed above, will give a signal to open long positions in the hope of continuing the recovery of the pair with the prospect of breaking through the nearest resistance of 1.0190, above which buyers yesterday failed to break through. A breakout and a top-down test of this range, together with weak statistics on the US, will hit the bears' stop orders, forming an additional signal to enter long positions with the possibility of updating 1.0221. The farthest goal will be a new maximum of 1.0243, where I recommend fixing the profits. With the option of a decline in EUR/USD and the absence of buyers at 1.0155, and this level has already been tested for strength at least three times, the pressure on the pair will increase, and things will go badly for euro buyers. In this case, the best option for opening long positions will be a false breakdown in the area of 1.0127. I advise buying EUR/USD immediately for a rebound only from 1.0099, or even lower – in the area of 1.0045 parity, with the aim of an upward correction of 30–35 points within a day.
To open short positions on EURUSD, you need:
Sellers did not show much desire to fail the 1.0155 level, which indicates that trading remains within the side channel and leaves buyers with a chance for a more powerful upward correction. If there are sellers, then by protecting 1.0190, it will be possible to get an excellent entry point into the market. The optimal scenario for opening short positions will be a false breakdown in the resistance area of 1.0190, leading to a repeated movement of the euro down to 1.0155. A breakdown and consolidation below this range and a reverse test from the bottom up would form an additional sell signal with the demolition of buyers' stop orders and a larger pair movement to the area of 1.0127. Fixing below this area will completely cancel out all buyers' plans to build an uptrend, opening a direct road to 1.0099 and 1.0073, where I recommend completely exiting sales. A more distant target will be the 1.0045 area. In the case of an upward movement of EUR/USD during the US session and the absence of bears at 1.0190 with very weak US data, the situation may change slightly in favor of buyers. In this case, I advise you to postpone short positions to 1.0221, but only if a false breakdown is formed there. You can sell EUR/USD immediately on a rebound from the maximum of 1.0243, or even higher – from 1.0267 with the aim of a downward correction of 30-35 points.

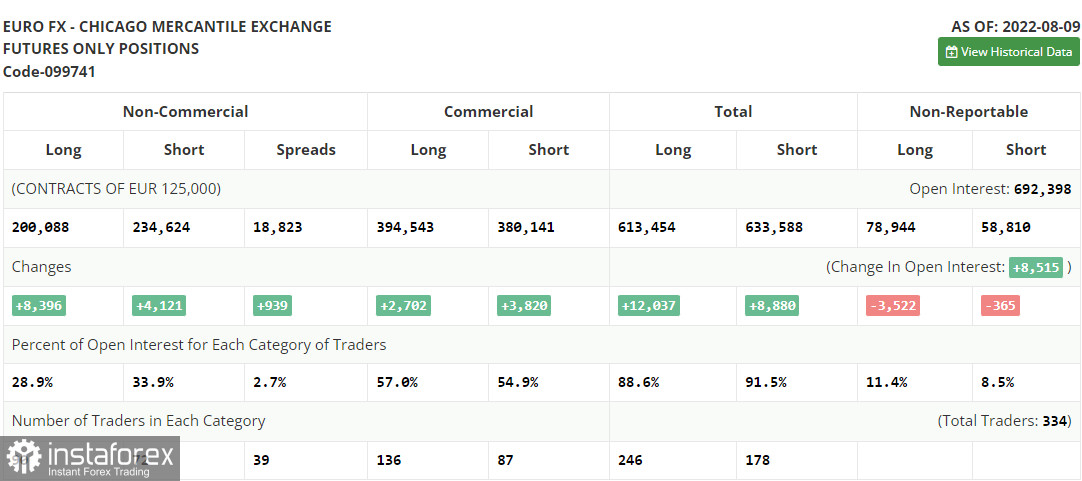
The COT report (Commitment of Traders) for August 9 recorded a sharp increase in both short and long positions. Still, the former turned out to be more, indicating the gradual end of the bear market and an attempt to find the market bottom after reaching the euro parity against the US dollar. Last week, statistics on inflation in the United States were released, which turned everything upside down. The first slowdown in inflationary pressure in recent years has returned to demand for risky assets. But, as you can see on the chart, it was not long. The risk of deterioration of the situation associated with the recession of the world economy discourages traders and investors from building up long positions in the euro. There are no important reports this week that could help the euro regain lost positions, so I recommend betting more on trading in the side channel. Certainly, serious market shocks can hardly be expected before the fall of this year. The COT report indicates that long non-commercial positions increased by 8,396 to the level of 200,088, while short non-commercial positions jumped by 4,121 to 234,624. At the end of the week, the total non-commercial net position, although it remained negative, slightly increased — from -39,811 to -34,536, which indicates the continuation of the market turning to the side of euro buyers. The weekly closing price rose to 1.0233 from 1.0206.
- Moving average (moving average determines the current trend by smoothing out volatility and noise). Period 50. The graph is marked in yellow.
- Moving average (moving average determines the current trend by smoothing out volatility and noise). Period 30. The graph is marked in green.
- MACD indicator (Moving Average Convergence / Divergence - moving average convergence/divergence) Fast EMA period 12. Slow EMA period 26. SMA period 9
- Bollinger Bands (Bollinger Bands). Period 20
- Non-profit speculative traders, such as individual traders, hedge funds, and large institutions use the futures market for speculative purposes and to meet certain requirements.
- Long non-commercial positions represent the total long open position of non-commercial traders.
- Short non-commercial positions represent the total short open position of non-commercial traders.
- Total non-commercial net position is the difference between the short and long positions of non-commercial traders.
 English
 Русский
 Bahasa Indonesia
 Bahasa Malay
 ไทย
ไทย Español
 Deutsch
 Български
 Français
 Tiếng Việt
 中文
中文 বাংলা
বাংলা हिन्दी
 Čeština
 Українська
 Română

