EUR/USD

Higher timeframes
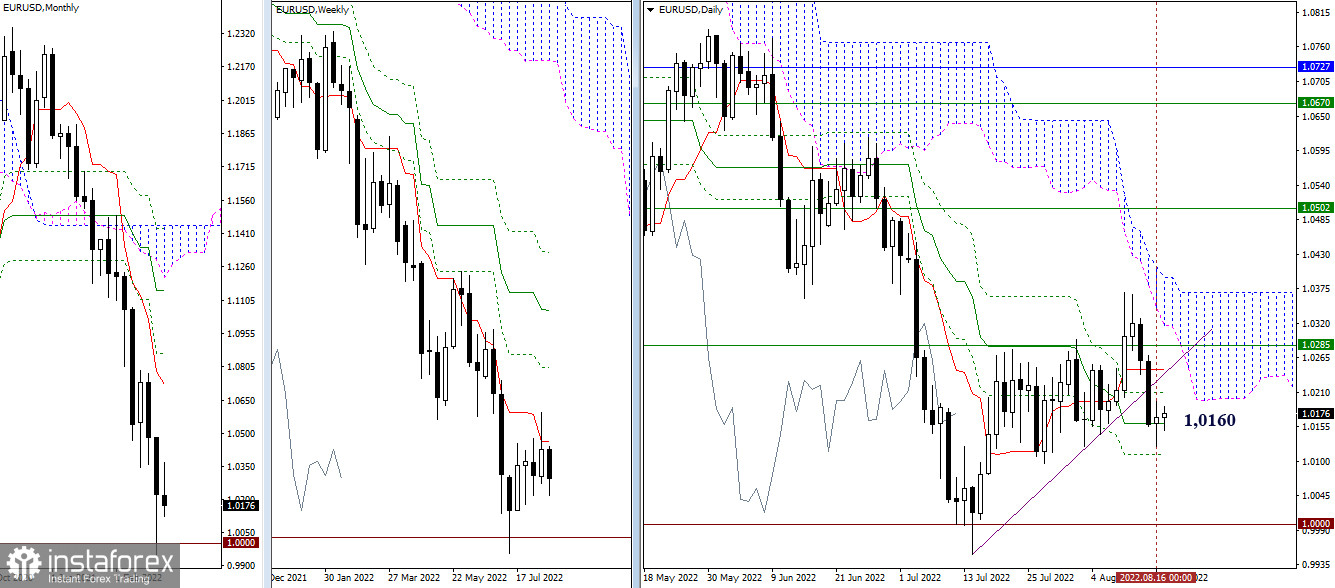
Yesterday, a slowdown was observed after meeting with the support of the daily medium-term trend (1.0160). An uncertainty candle has formed. For bears, the main task remains the elimination of the daily Ichimoku golden cross, its final level is now at the turn of 1.0111. If the bulls seized the initiative, the nearest resistance for them is located today at 1.0210 (daily Fibo Kijun) – 1.0246 (daily short-term trend) – 1.0285 (weekly short-term trend).

H4 – H1
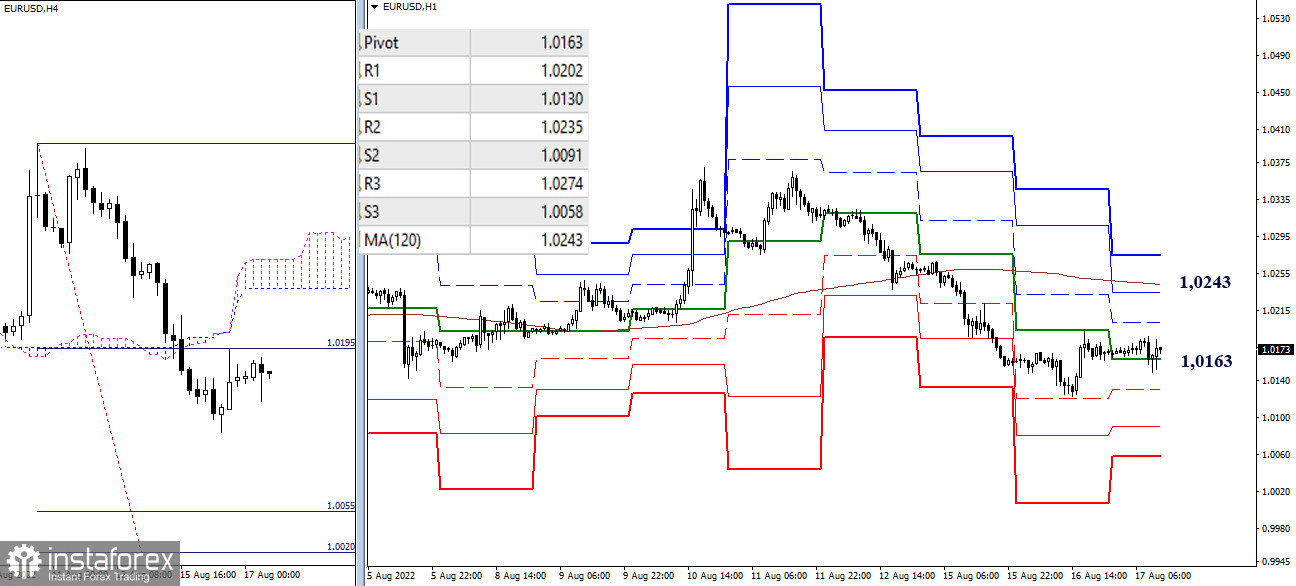
On the lower timeframes, the pause formed a long-term correction. The pair is in the zone of attraction of the central pivot point (1.0163), but at the same time, the advantages continue to be on the bears' side. If the decline continues, we can note the support of the classic pivot points (1.0130 – 1.0091 – 1.0058) as reference points within the day. If bulls continue to rise and consolidate above the weekly long-term trend (1.0243), then a change in priorities and balance of power may occur.
***
GBP/USD

Higher timeframes
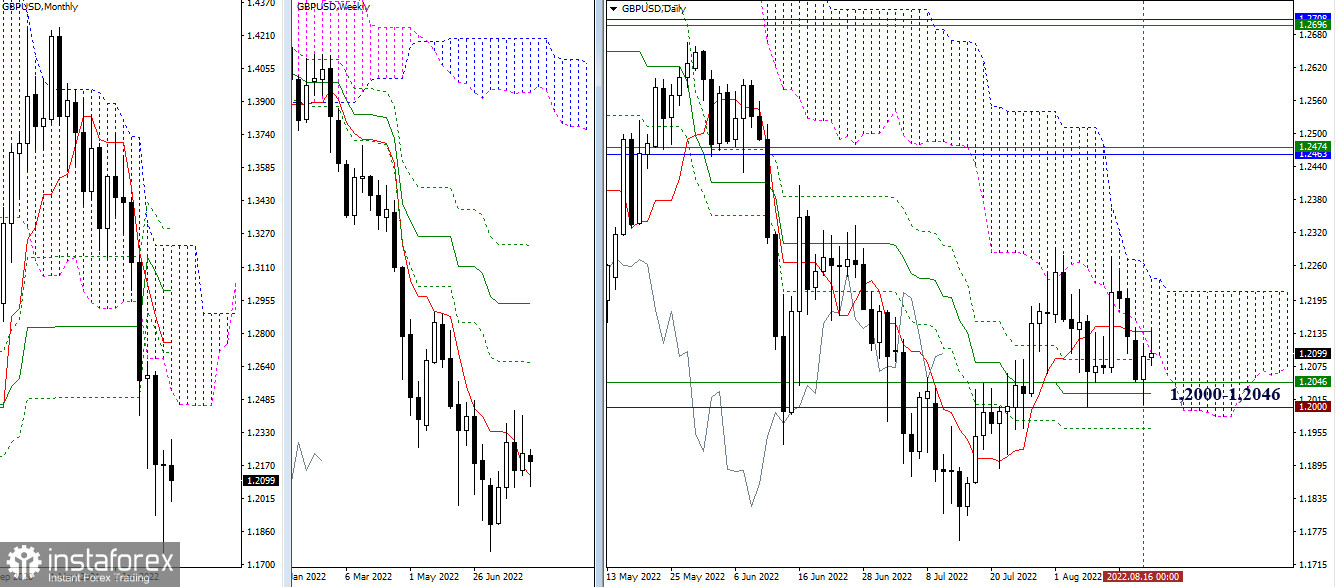
Testing the support zone 1.2000 (psychological level) – 1.2026 (daily medium-term trend) – 1.2046 (weekly short-term trend) led to a slowdown and the formation of a daily rebound. The pair is now testing the resistance of the daily short-term trend (1.2140). Consolidation above will allow us to hope for confirmation and development of the daily correction. The next task, in this case, will be to enter the bullish zone relative to the daily cloud (1.2212).

H4 – H1
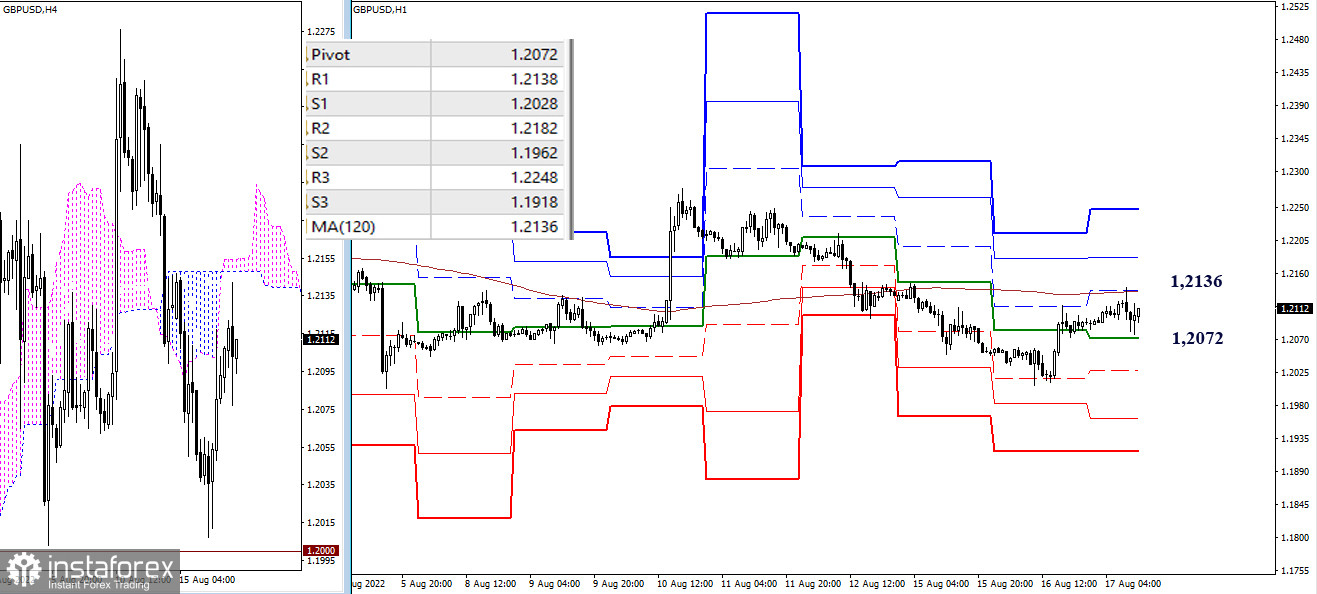
Bulls have implemented a corrective rise and have now begun testing the resistance of the weekly long-term trend (1.2136). Consolidation above and reversal of the moving average can change the current balance of power in favor of strengthening bullish sentiment. Further resistance may come from the classic pivot points at 1.2182 (R2) and 1.2248 (R3). When the decline resumes, support will most likely be 1.2028 – 1.1962 – 1.1918 (classic pivot points).
***
In the technical analysis of the situation, the following are used:
higher timeframes – Ichimoku Kinko Hyo (9.26.52) + Fibo Kijun levels
H1 - Pivot Points (classic) + Moving Average 120 (weekly long-term trend)
 English
 Русский
 Bahasa Indonesia
 Bahasa Malay
 ไทย
ไทย Español
 Deutsch
 Български
 Français
 Tiếng Việt
 中文
中文 বাংলা
বাংলা हिन्दी
 Čeština
 Українська
 Română

