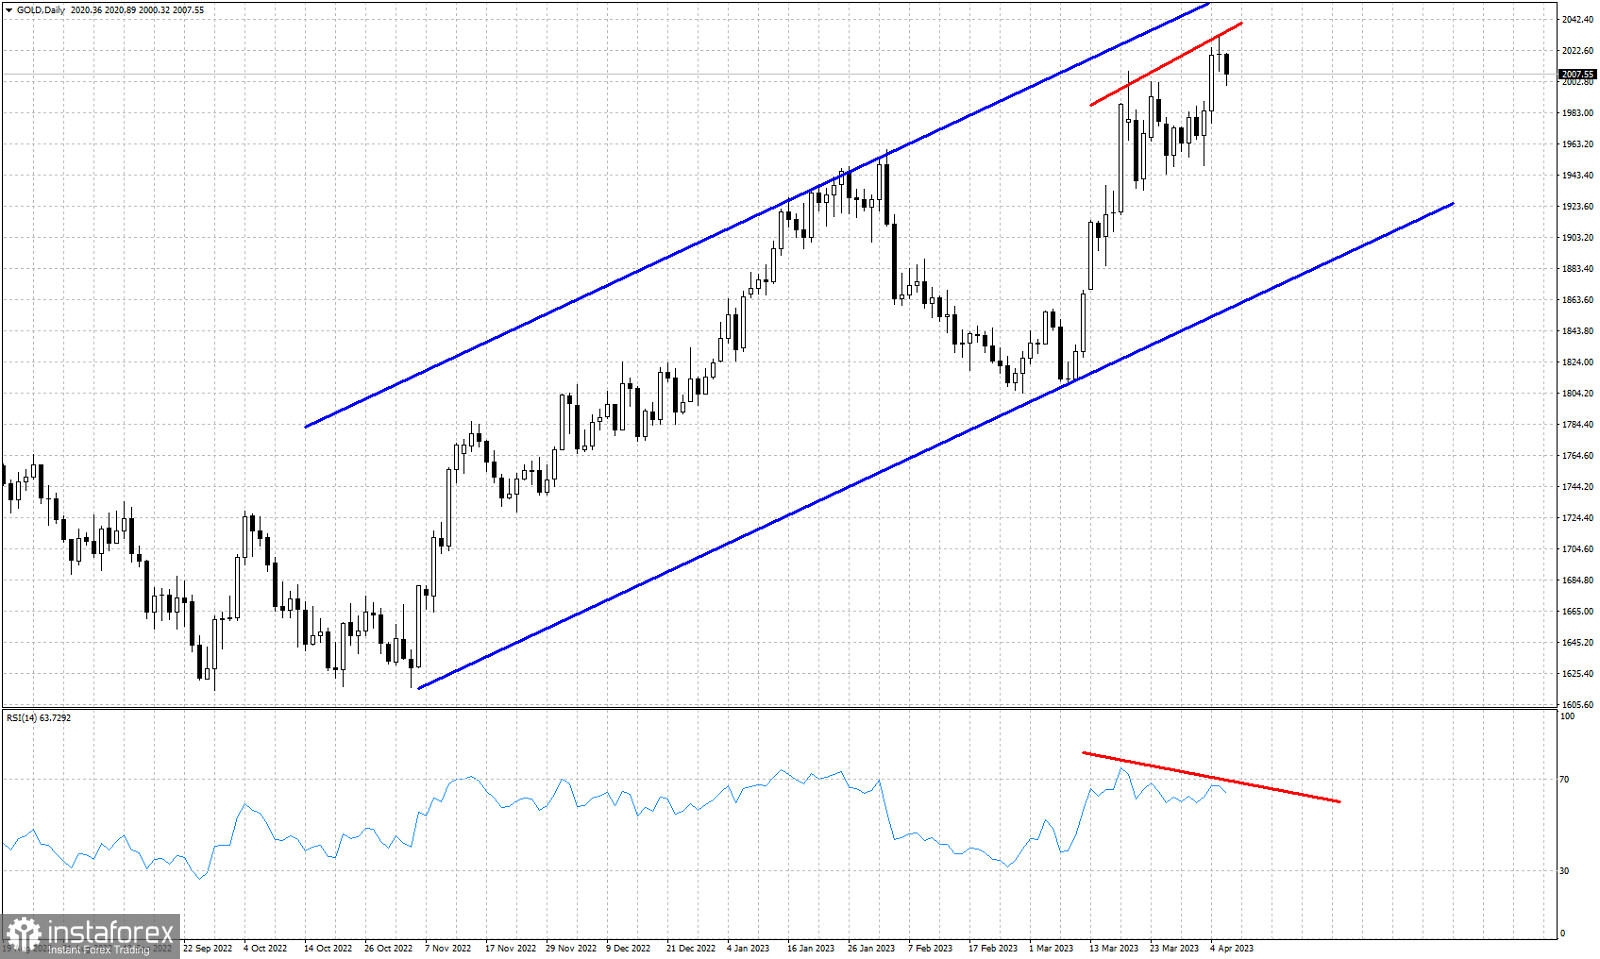
Blue lines- bullish channel
Red lines- bearish RSI divergence
Gold price is trading just above $2,000. Technically trend remains bullish as price is still inside the upward sloping channel making higher highs and higher lows. Price is very close to the upper channel boundary and so far we haven't yet reached our $2,050-60 target area. After the triangle breakout to the upside it is not necessary for price to reach $2,050-60 in order to form a top. A confirmation of a reversal will come with a break below $1,975. This would provide a reversal signal with increased chances of moving even lower towards $1,875. The is providing bearish divergence signals, suggesting that the up trend is weakening.
 English
 Русский
 Bahasa Indonesia
 Bahasa Malay
 ไทย
ไทย Español
 Deutsch
 Български
 Français
 Tiếng Việt
 中文
中文 বাংলা
বাংলা हिन्दी
 Čeština
 Українська
 Română

