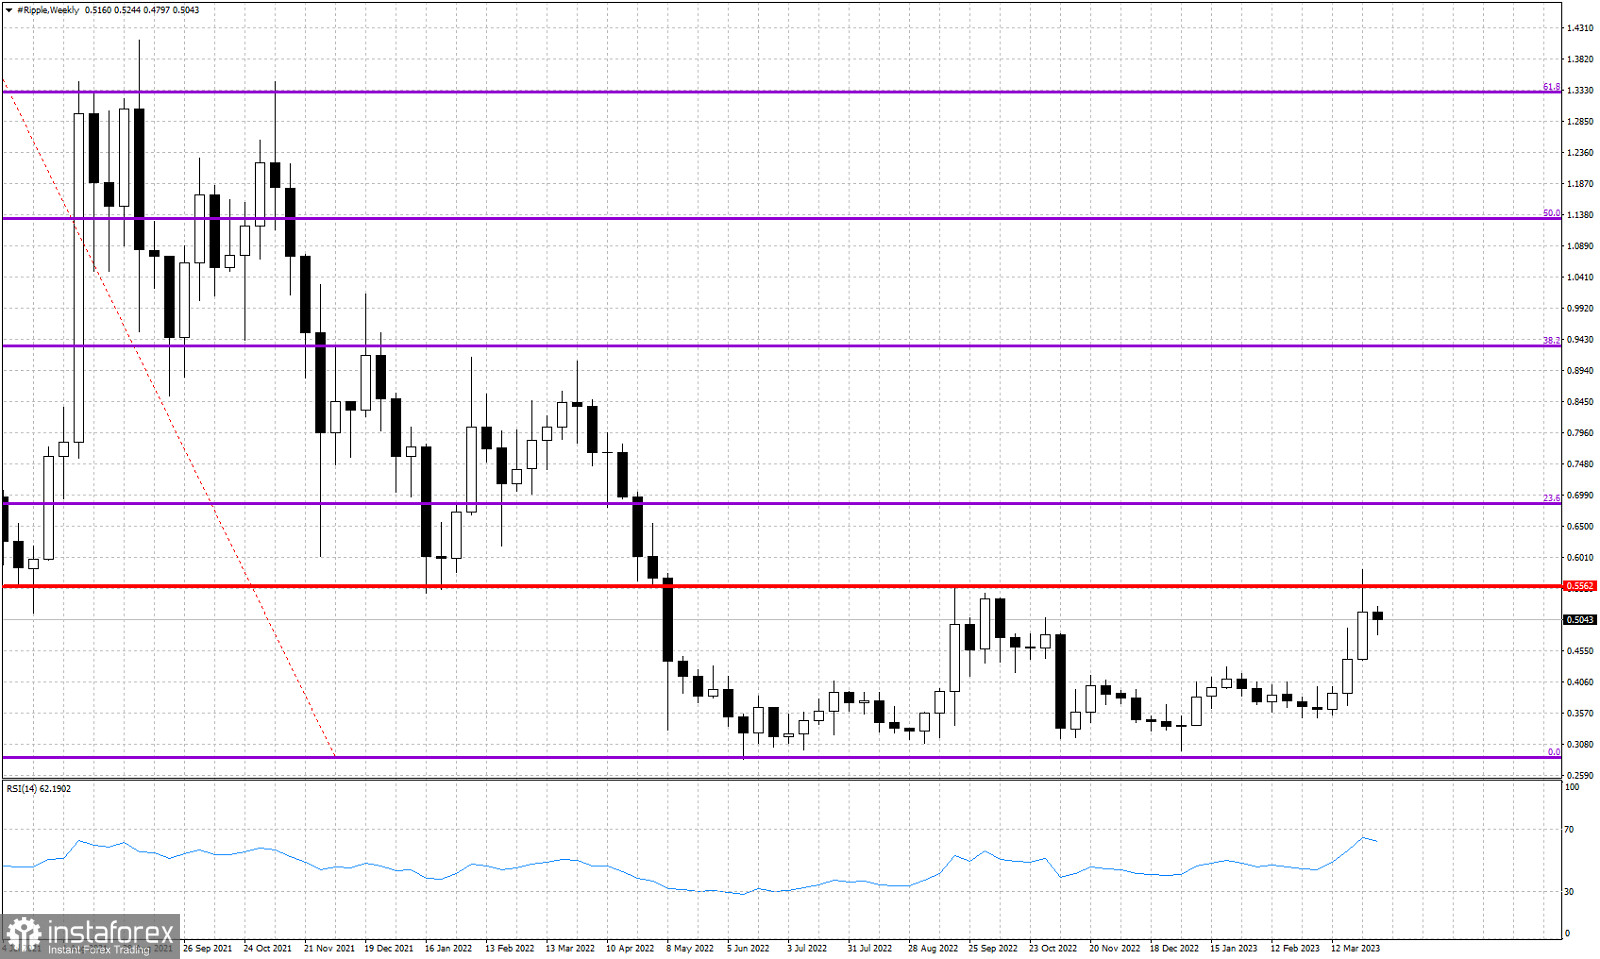
Violet lines- Fibonacci retracement levels
Red line- horizontal resistance
XRPUSD is trading around $0.50. Price recently made an attempt to break above the key horizontal resistance and August-September 2022 highs. Bulls failed to make a weekly close above the resistance and price is under pressure this week. Technically trend remains bullish in the near term as price is making higher highs and higher lows. Bulls would like to see a weekly close above $0.55. That would help a lot and it would increase the bullish momentum and would help to see price move towards the 38% Fibonacci retracement level. Support is found at last week's lows at $0.44. Bulls do not want to see price below that level. Failure to hold above $0.44 would be a major sign of weakness.
 English
 Русский
 Bahasa Indonesia
 Bahasa Malay
 ไทย
ไทย Español
 Deutsch
 Български
 Français
 Tiếng Việt
 中文
中文 বাংলা
বাংলা हिन्दी
 Čeština
 Українська
 Română

