GBP/USD 5M

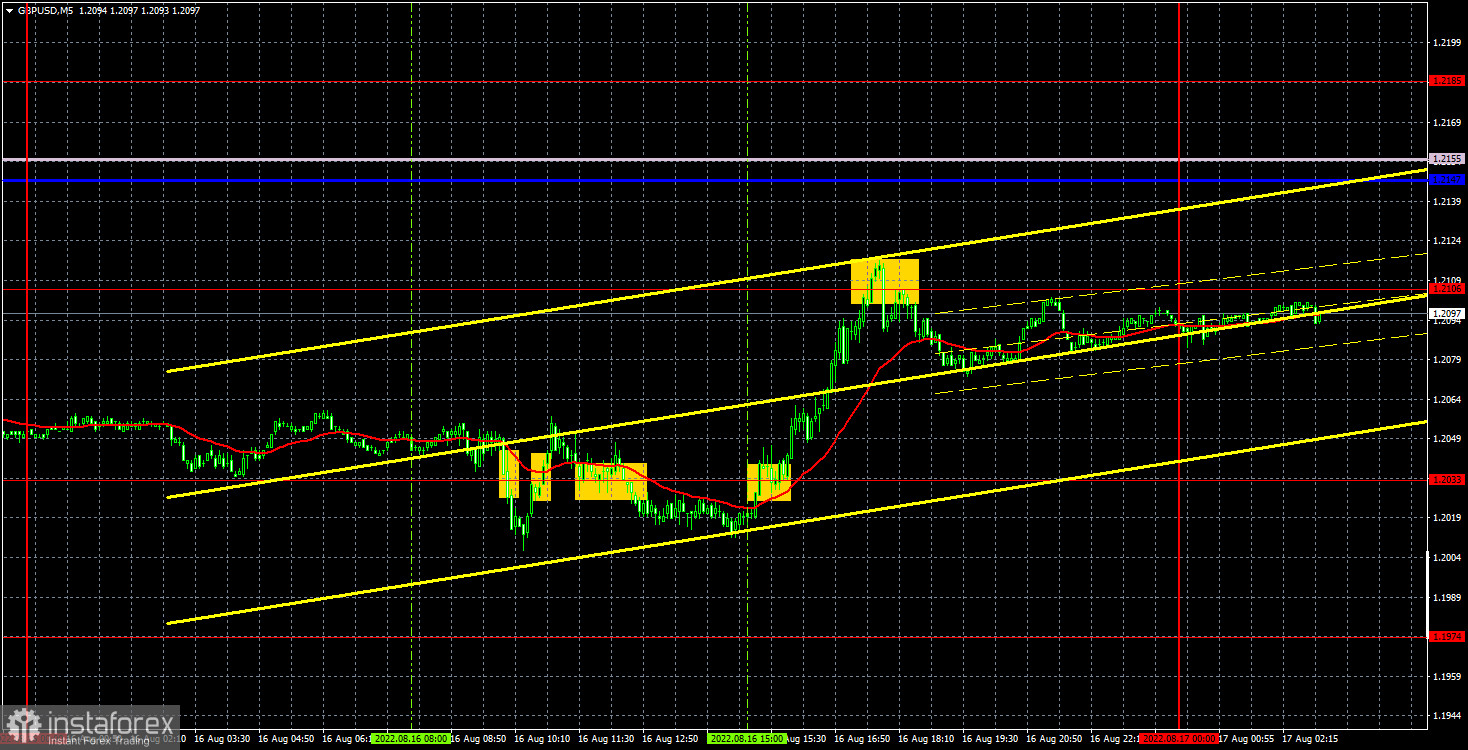
The GBP/USD currency pair traded almost identically to the EUR/USD pair on Tuesday. However, after several weeks of "disagreements", both pairs became friends again and are now trading the same way again. For example, yesterday the pound quotes fell to their last local low, rebounded from it and showed a purely technical correction. Just like the euro. It should be noted that unlike in the US or the EU, there were several interesting reports in the UK yesterday. Unfortunately, their values or the essence itself did not make it possible to influence the movement of the currency pair. However, yesterday we warned that these reports are not the most important. When they were published in the morning, the hourly volatility was 20 points. Thus, the pound has only retreated from the important level of 1.2007, but is unlikely to have completed another downward trend. Recall that after the release of the report on inflation in the US, the pound had a good opportunity to maintain an upward trend, but could not overcome the level of 1.2259, and the bulls' fuse dried up very quickly.
Everything in regards to Tuesday's trading signals was very bad. In fact, all signals were formed near the level of 1.2033, since the last signal near the level of 1.2106 was formed too late and should not have been worked out. Three out of four signals near the 1.2033 level turned out to be false. Thus, it was possible to work out only the first two. If the first deal was closed by Stop Loss at breakeven, then the second deal resulted in a loss of about 20 points. Not the most successful day also because the strongest signal (the fourth) could not be worked out.
COT report:

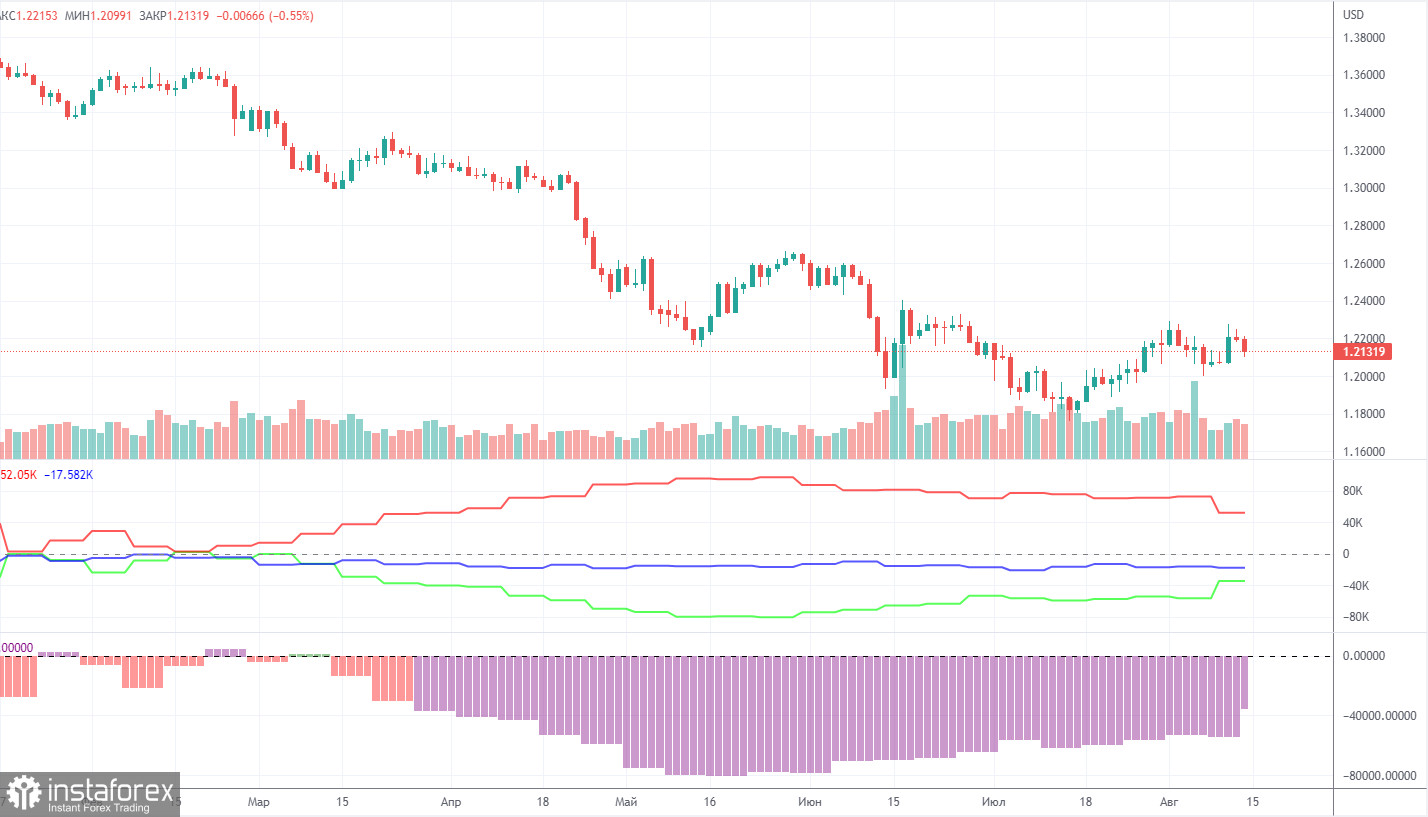
The latest Commitment of Traders (COT) report on the British pound has finally impressed. During the week, the non-commercial group opened 12,900 long positions and closed 9,000 short positions. Thus, the net position of non-commercial traders immediately increased by 21,900. This is quite a strong change for the pound. However, the mood of the big players still remains "pronounced bearish", which is clearly seen in the second indicator in the chart above (purple bars below zero = bearish mood). To be fair, in recent months the net position of the non-commercial group has been constantly growing, but the pound shows only a very weak tendency to increase. The growth of the net position and the growth of the pound itself are now so weak (if we talk globally), it's hard to draw a conclusion about the beginning of a new upward trend. It is rather difficult to call the current growth even a "correction". We also said that the COT reports do not take into account the demand for the dollar, which is likely to remain very high right now. Therefore, for the British currency to appreciate, the demand for it must rise faster and stronger than the demand for the dollar. And on the basis of what factors is the demand for the pound growing now? Traders have already been hard at work ignoring strong US data and a 0.75% Fed tightening in recent weeks. The pound could already go again to conquer 2-year lows.
The non-commercial group now has a total of 76,000 short positions and 42,000 long positions open. The net position will have to show growth for a long time to at least equalize these figures.
We recommend to familiarize yourself with:
Overview of the EUR/USD pair. August 17. The first two trading days of the week showed which way traders are looking.
Overview of the GBP/USD pair. August 17. The pound is stuck. The first part of the statistics package this week was left without attention.
Forecast and trading signals for EUR/USD on August 17. Detailed analysis of the movement of the pair and trading transactions.
GBP/USD 1H

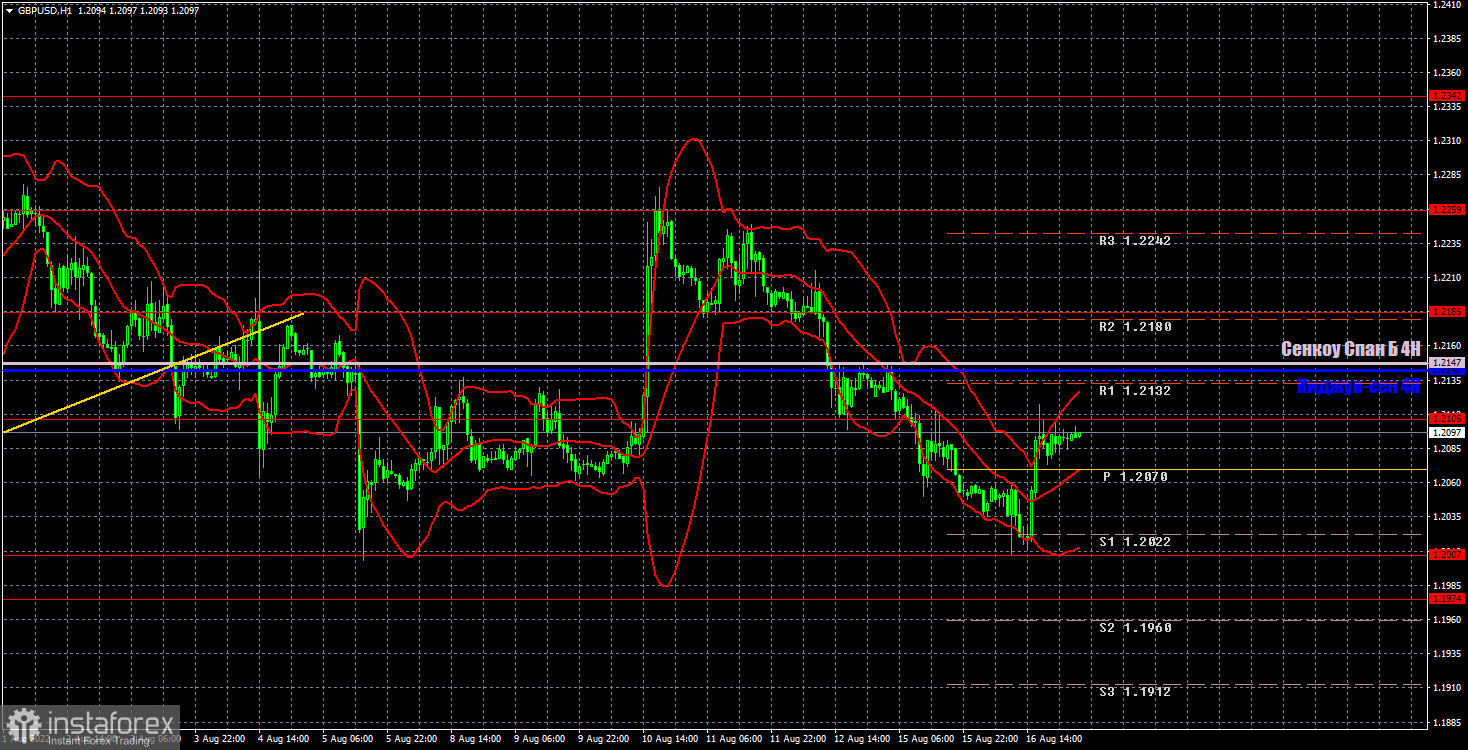
The pair failed to consolidate above the level of 1.2259 and fell to the level of 1.2007 on the hourly timeframe, which is similar to the level of 1.2033, which we removed from the chart. The fact that the price failed to overcome the 1.2007 level is alarming, as this is already the second attempt to overcome it. However, while the price is below the Ichimoku indicator lines, the downward trend persists, although it is not obvious, since the pair has been in a downward movement for only three days. We highlight the following important levels on August 17: 1.1874, 1.1974, 1.2007, 1.2106, 1.2185, 1.2259, 1.2342. Senkou Span B (1.2147) and Kijun-sen (1.2142) lines can also be sources of signals. Signals can be "rebounds" and "breakthrough" of these levels and lines. The Stop Loss level is recommended to be set to breakeven when the price passes in the right direction by 20 points. Ichimoku indicator lines can move during the day, which should be taken into account when determining trading signals. The chart also contains support and resistance levels that can be used to take profits on trades. A report of medium importance on retail sales is scheduled in the US, and in the UK, of course, an important one - on inflation. The inflation report can seriously affect the pair's movement, and even determine the future prospects for the pound.
Explanations for the chart:
Support and Resistance Levels are the levels that serve as targets when buying or selling the pair. You can place Take Profit near these levels.
Kijun-sen and Senkou Span B lines are lines of the Ichimoku indicator transferred to the hourly timeframe from the 4-hour one.
Support and resistance areas are areas from which the price has repeatedly rebounded off.
Yellow lines are trend lines, trend channels and any other technical patterns.
Indicator 1 on the COT charts is the size of the net position of each category of traders.
Indicator 2 on the COT charts is the size of the net position for the non-commercial group.
 English
 Русский
 Bahasa Indonesia
 Bahasa Malay
 ไทย
ไทย Español
 Deutsch
 Български
 Français
 Tiếng Việt
 中文
中文 বাংলা
বাংলা हिन्दी
 Čeština
 Українська
 Română

