GBP/USD
Analysis:
The British pound has been moving within the downtrend since last February. When determining its further direction, keep in mind that on a weekly time frame this wave is just a correction preceding a full-fledged rise of the quote. Within the recent section formed since July 5, the price has been building an interim correction in the form of a horizontal pennant pattern. The wave structure looks complete. The descending section from August 10 has a reversal potential.
Forecast:
In the next week, the price is expected to complete the uptrend, reverse, and resume a decline. During a trend reversal, volatility may sharply increase, and the price may shortly break through the resistance zone. The estimated support level shows the lower boundary alongside which the price will be moving this week.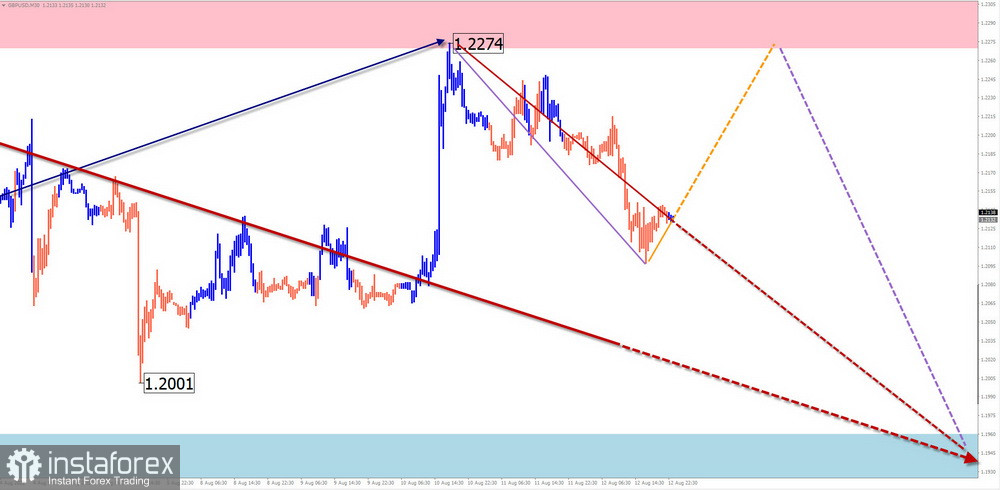
Potential reversal zones:
Resistance:- 1.2270/1.2320Support:- 1.1960/1.1910
Recommendations:
Buying the British pound in the coming days can bring profit if trading with a reduced lot on the intraday chart. It is recommended to stay out of the market until confirming sell signals appear near the resistance zone.
AUD/USD
Analysis:
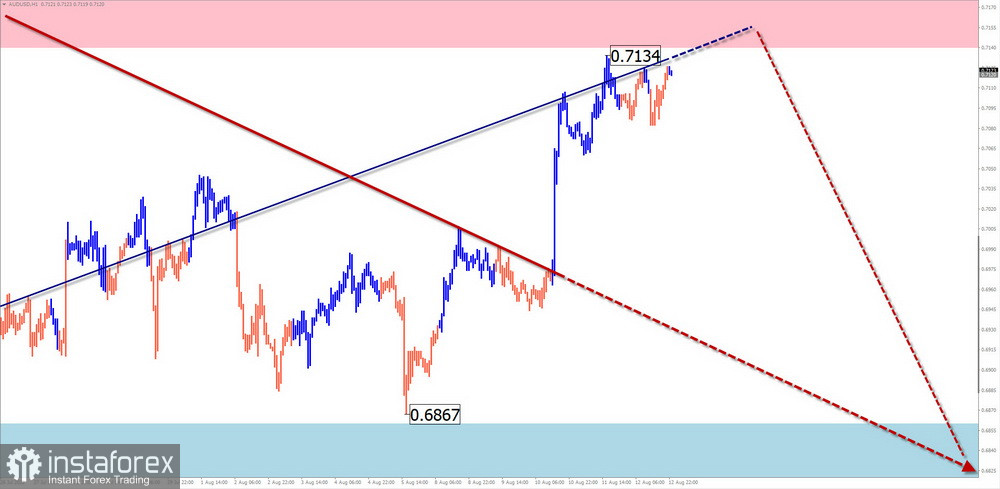
The Australian dollar continues to follow the bearish trend. The unfinished section of the trend was formed on April 5. The correction in the form of an extended channel is nearing its completion within this trend. The quote has reached a strong reversal zone. The wave structure looks complete although there are currently no signals of an upcoming reversal.
Forecast:
At the beginning of the week, the upward movement is likely to continue up to the estimated resistance zone. Then, a trend reversal may take place and the downtrend may resume. The support zone shows the most expected lower level where the pair may go this week.
Potential reversal zones:
Resistance:- 0.7140/0.7190Support:- 0.6960/0.6910
Recommendations:
At the moment, there are no conditions to buy the Australian dollar. It is recommended to stay out of the market until your trading system generates confirming sell signals.
USD/CHF
Analysis:
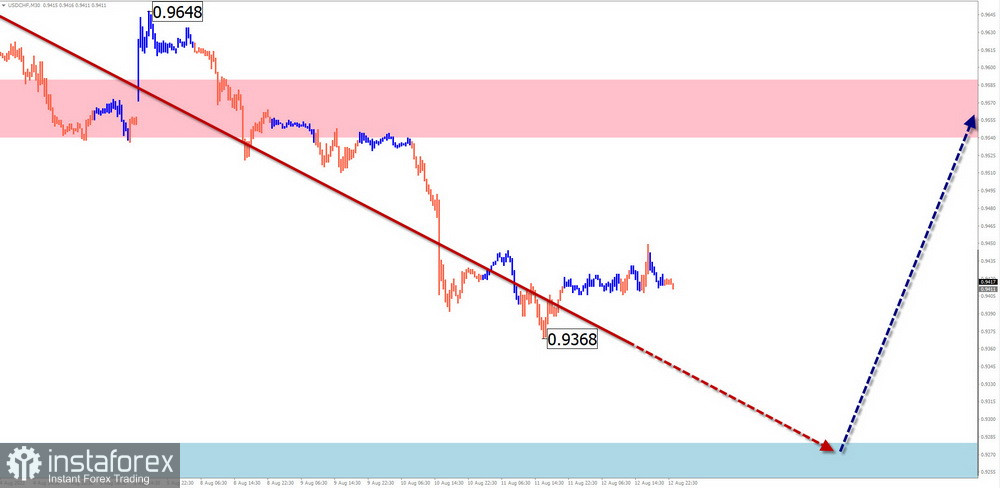
The Swiss franc continues to trade within the descending wave that was formed in May. On a higher time frame, it is considered to be a correction. The wave structure is nearing its completion. The price is approaching the upper boundary of the target zone.
Forecast:
At the beginning of the week, the pair is likely to extend its fall. The decline may stop near the support zone where a trend reversal may occur. The change in the price trajectory and the resumption of the upward movement may take place by the end of the week.
Potential reversal zones:
Resistance:- 0.9540/0.9590Support:- 0.9280/0.9230
Recommendations:
In the coming days, you can try selling the pair with a fractional lot. When the price reaches the support zone, you should close all positions and look for signals to buy.
EUR/JPY
Analysis:
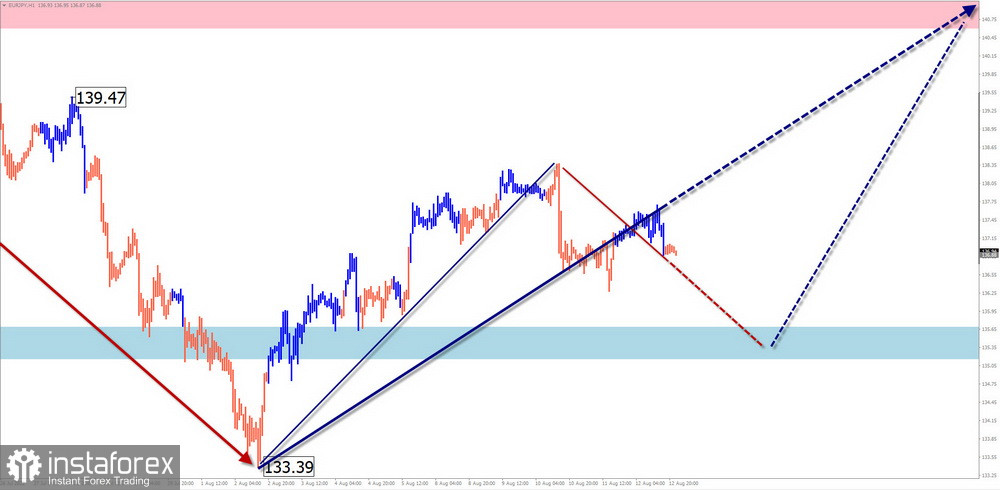
Lately, the euro/yen cross pair has been moving within the trend set by the ascending wave from March 7. In its structure, the first two sections of the wave (A-B) are completed. On August 8, the final section (C) began to move up. In the course of the previous week, the price was forming an intermediate pullback.
Forecast:
The sideways movement of the price is likely to end near the support zone at the start of the week. Most likely, by the end of the week, the pair will reverse and develop an uptrend. The resistance zone demonstrates the upper boundary for the price.
Potential reversal zones:
Resistance:- 140.60/141.10Support:- 135.70/135.20
Recommendations:
Selling EUR/JPY can be quite risky at this time and is not advisable. It is better to stay out of the market until confirmed buy signals appear in the support zone.
NZD/USD
Analysis:
The NZD/USD pair has been moving downwards since February last year. In the last two months, the price has been correcting sideways, forming an extended channel on the chart. The structure of the wave looks complete although there are currently no signs of an upcoming trend reversal.
Forecast:
In the first days of the week, the pair is likely to trade flat within the boundaries of the resistance zone. Then the downward movement can be activated, so the price will reverse and decline. During a trend reversal, the price may shortly break through the resistance zone.
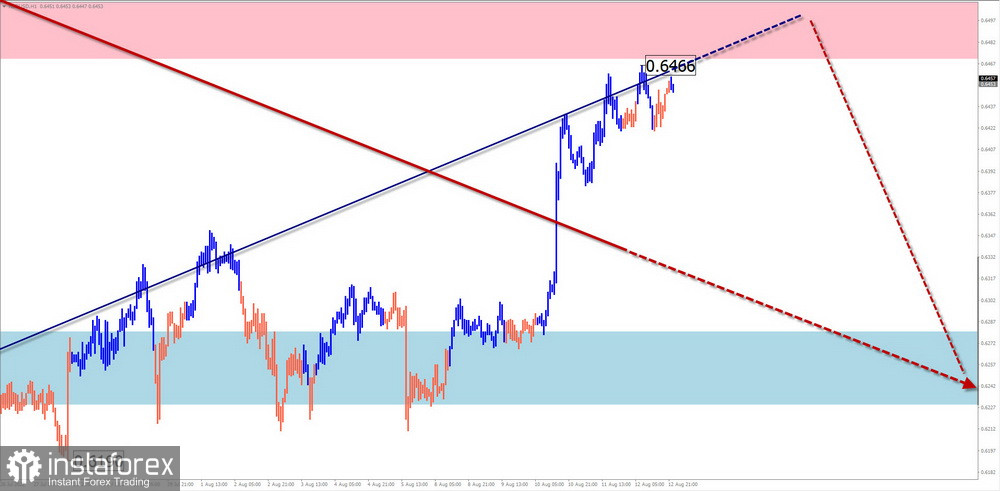
Potential reversal zones
Resistance:- 0.6470/0.6520Support:- 0.6280/0.6230
Recommendations:
Currently, there are no conditions for buying the pair. It is recommended to refrain from trading until confirmed sell signals appear in the resistance zone.
#Ethereum
Analysis:
It seems that Ethereum is gaining ground. Since mid-June, the coin has been pulling back to the upside. The upside potential suggests that the price will be correcting against the previous decline. The nearest pivot point is found in the estimated resistance area.
Forecast:
In the coming week, the price is expected to head slowly towards the resistance zone. On the first days of the week, the price may enter a flat channel. Besides, a decline to the support zone cannot be ruled out.
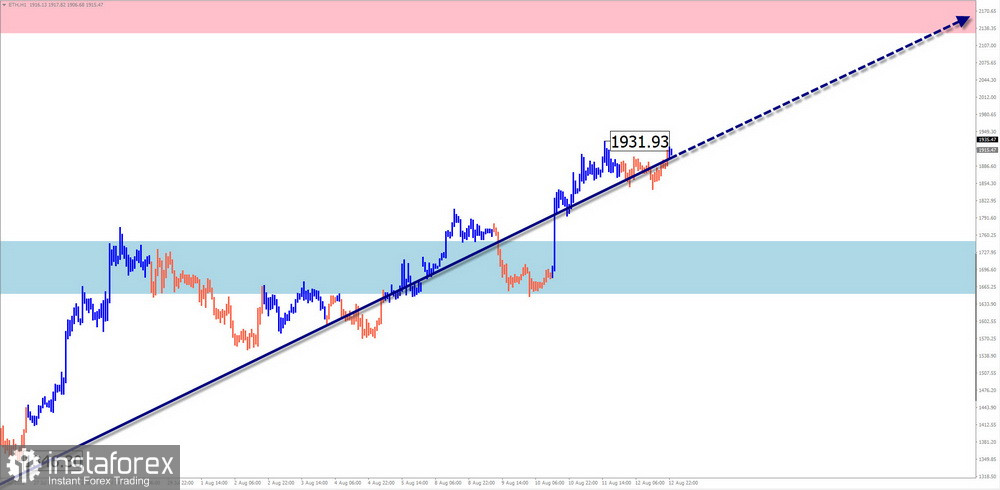
Potential reversal zones:
Resistance:- 2130.0/2230.0Support:- 1750.0/1650.0
Recommendations:
This week, we may see an opportunity to buy this cryptocurrency. It is better to open positions from the estimated support zone.
Explanation: In Simplified Wave Analysis (SWA), all waves consist of 3 parts (A-B-C). We analyze only the last incomplete wave on each time frame. The solid line of an arrow shows the formed structure while the dotted line shows the expected movement.
Note: The wave algorithm under analysis does not take into account the trajectory of the instrument through time.
 English
 Русский
 Bahasa Indonesia
 Bahasa Malay
 ไทย
ไทย Español
 Deutsch
 Български
 Français
 Tiếng Việt
 中文
中文 বাংলা
বাংলা हिन्दी
 Čeština
 Українська
 Română

