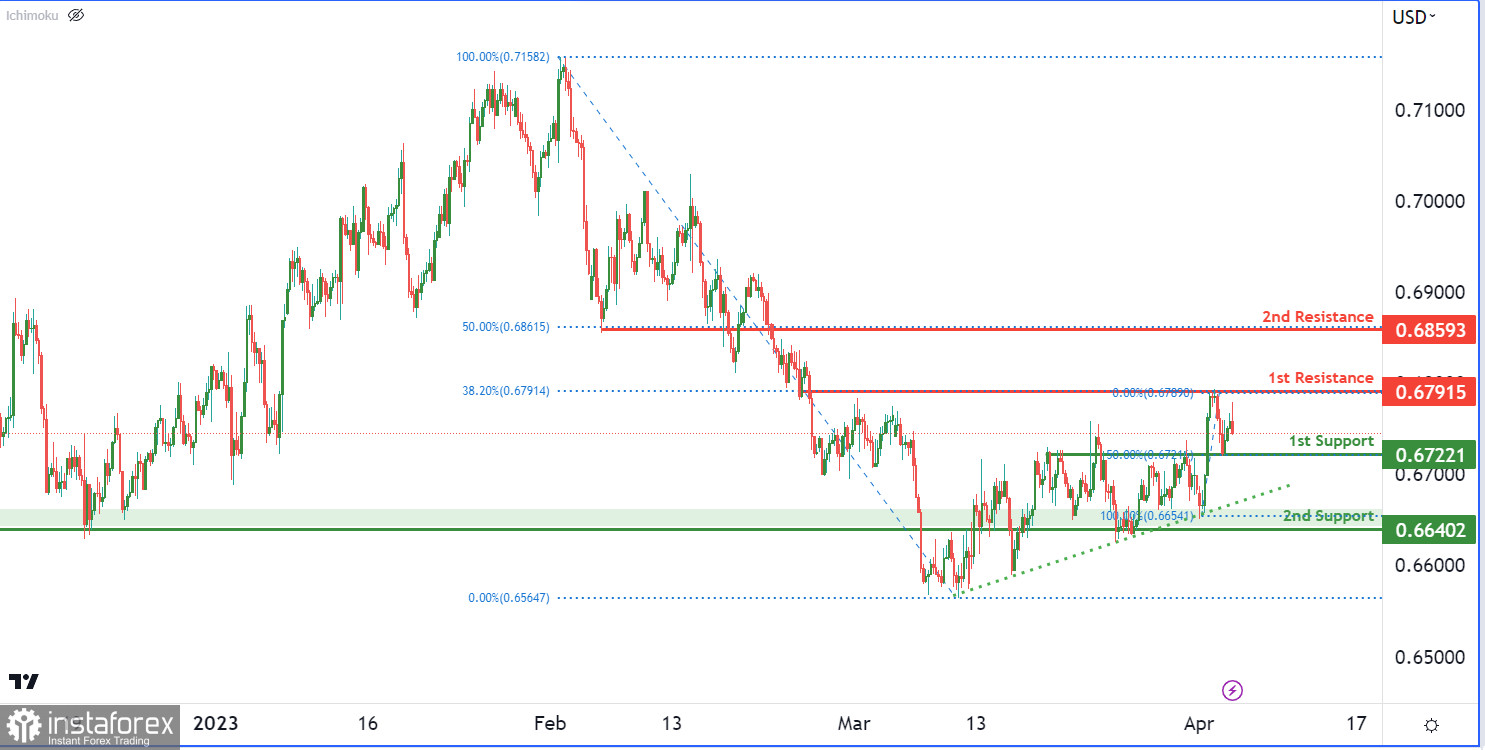
The AUD/USD chart exhibits strong bullish momentum, signaling the potential for prices to rise towards the 1st resistance. The overall bias is bullish, as the price is currently above the Ichimoku cloud with no significant resistance impeding a possible uptrend.
At present, the 1st support level is located at 0.6722, which is a strong overlap support level that also aligns with a 50% Fibonacci retracement. This level has been tested multiple times in the past and may provide robust support if prices were to decline.
Should prices bounce off the 1st support level, it may surge towards the 1st resistance at 0.6791. This level also represents an overlap resistance and coincides with a 38.20% Fibonacci retracement. If this resistance level is breached, it could lead to a bullish acceleration towards the 2nd resistance at 0.6859, which is also an overlap resistance and a 50% Fibonacci retracement level.
Furthermore, the 2nd support level at 0.6640 is another overlap support level that could offer additional support in the event of further price declines.

 English
 Русский
 Bahasa Indonesia
 Bahasa Malay
 ไทย
ไทย Español
 Deutsch
 Български
 Français
 Tiếng Việt
 中文
中文 বাংলা
বাংলা हिन्दी
 Čeština
 Українська
 Română

