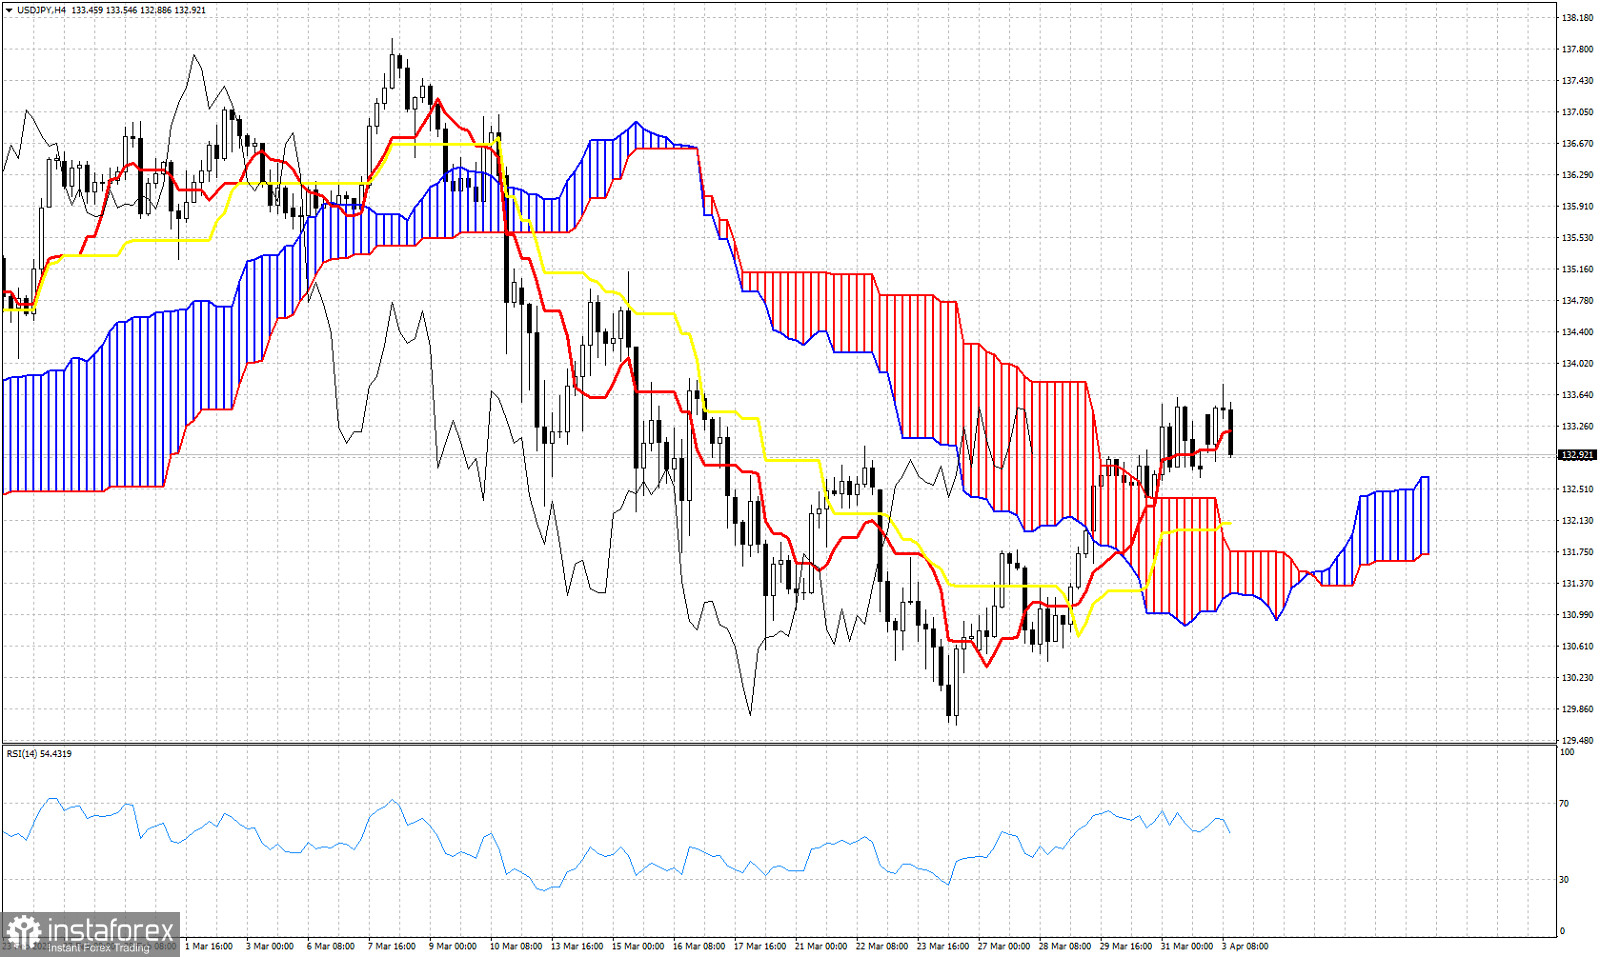
USDJPY is trading around 133. In Ichimoku cloud terms USDJPY is in a bullish trend in the 4hour chart. However there are signs of weakness suggesting that a pull back towards the Kumo is very possible. USDJPY is currently trading below the tenkan-sen (red line indicator). A 4hour candlestick close below 133.20 would imply that price could move even lower towards the kijun-sen (yellow line indicator) at 132.10. The Chikou span (black line indicator) is above the candlestick pattern (bullish). Price only recently broke out and above the Kumo. In cases like this we usually see a back test pull back towards the cloud support. Price usually forms a higher low by testing the cloud once again and confirming support is strong. For now in the near term the Ichimoku cloud indicator is pointing to a possible move towards 132-131.75.
 English
 Русский
 Bahasa Indonesia
 Bahasa Malay
 ไทย
ไทย Español
 Deutsch
 Български
 Français
 Tiếng Việt
 中文
中文 বাংলা
বাংলা हिन्दी
 Čeština
 Українська
 Română

