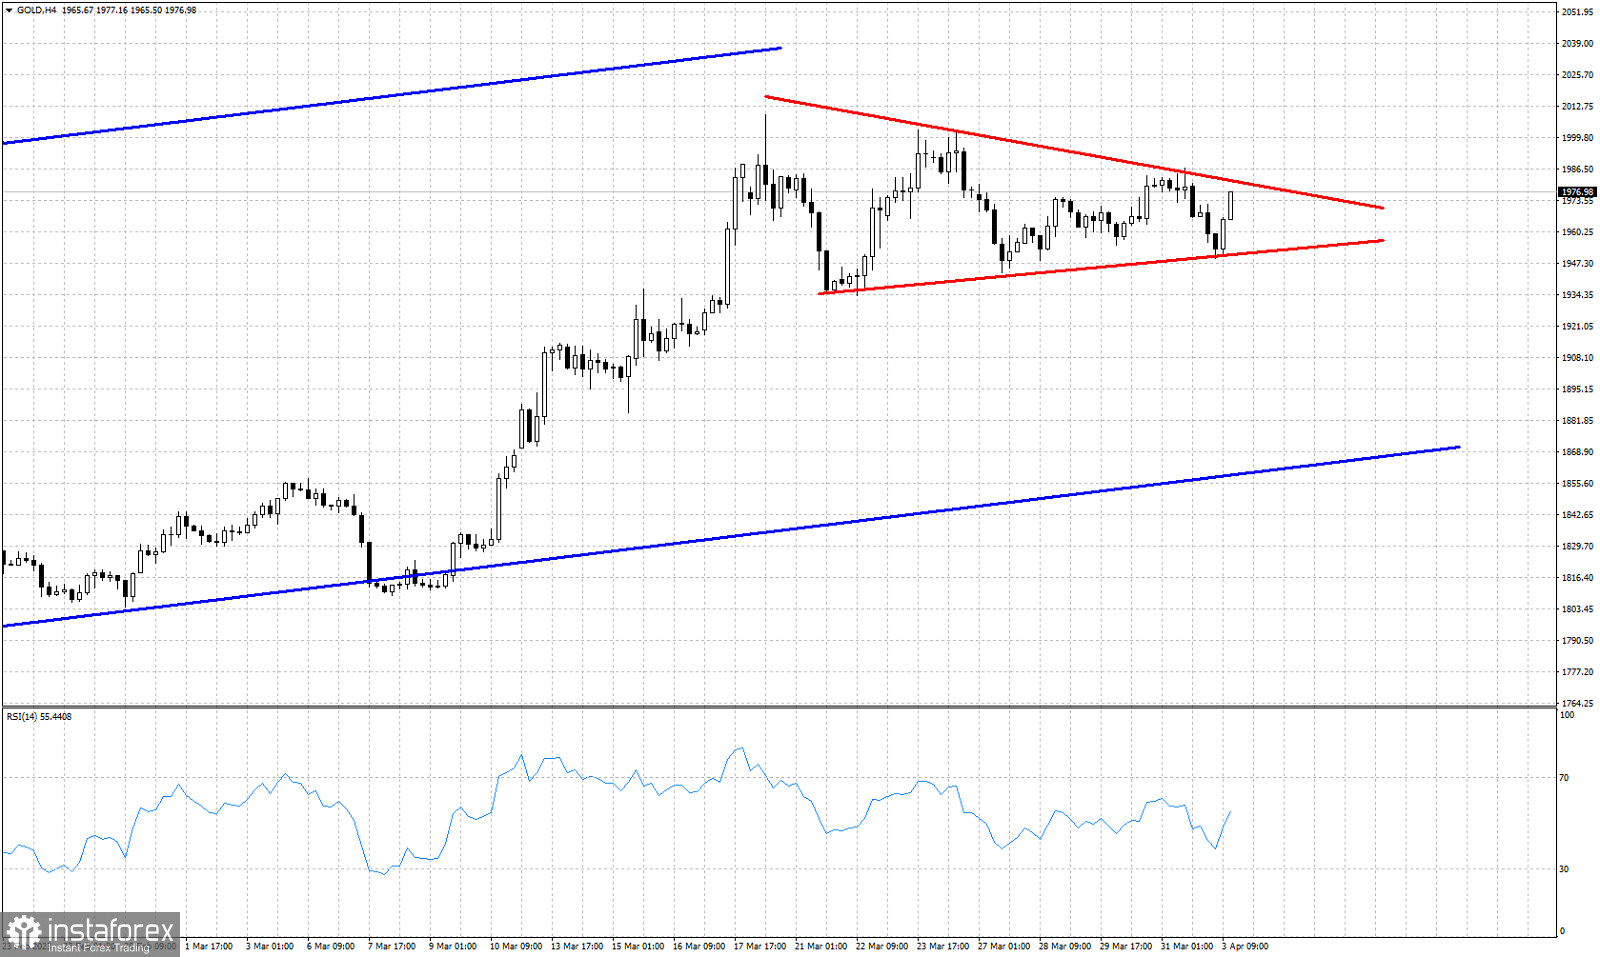
Blue lines- bullish channel
Red lines- triangle pattern
Gold price is trading around $1,976. Price continues to trade inside the triangle pattern respecting the boundaries. Price got rejected on Friday at the upper triangle boundary at $1,987. Today price remained under pressure and pulled back towards the lower boundary at $1,949. Support was respected. Price is bouncing off the lower boundary towards the resistance of the upper triangle boundary at $1,982. Price remains in the upward sloping bullish channel. The upper channel boundary is at $2,050-$2,060 and can be achieved if price breaks out and above the triangle pattern. Failure to defend $1,949 could lead to a move towards the lower channel boundary at $1,860.
 English
 Русский
 Bahasa Indonesia
 Bahasa Malay
 ไทย
ไทย Español
 Deutsch
 Български
 Français
 Tiếng Việt
 中文
中文 বাংলা
বাংলা हिन्दी
 Čeština
 Українська
 Română

