NZD/USD:

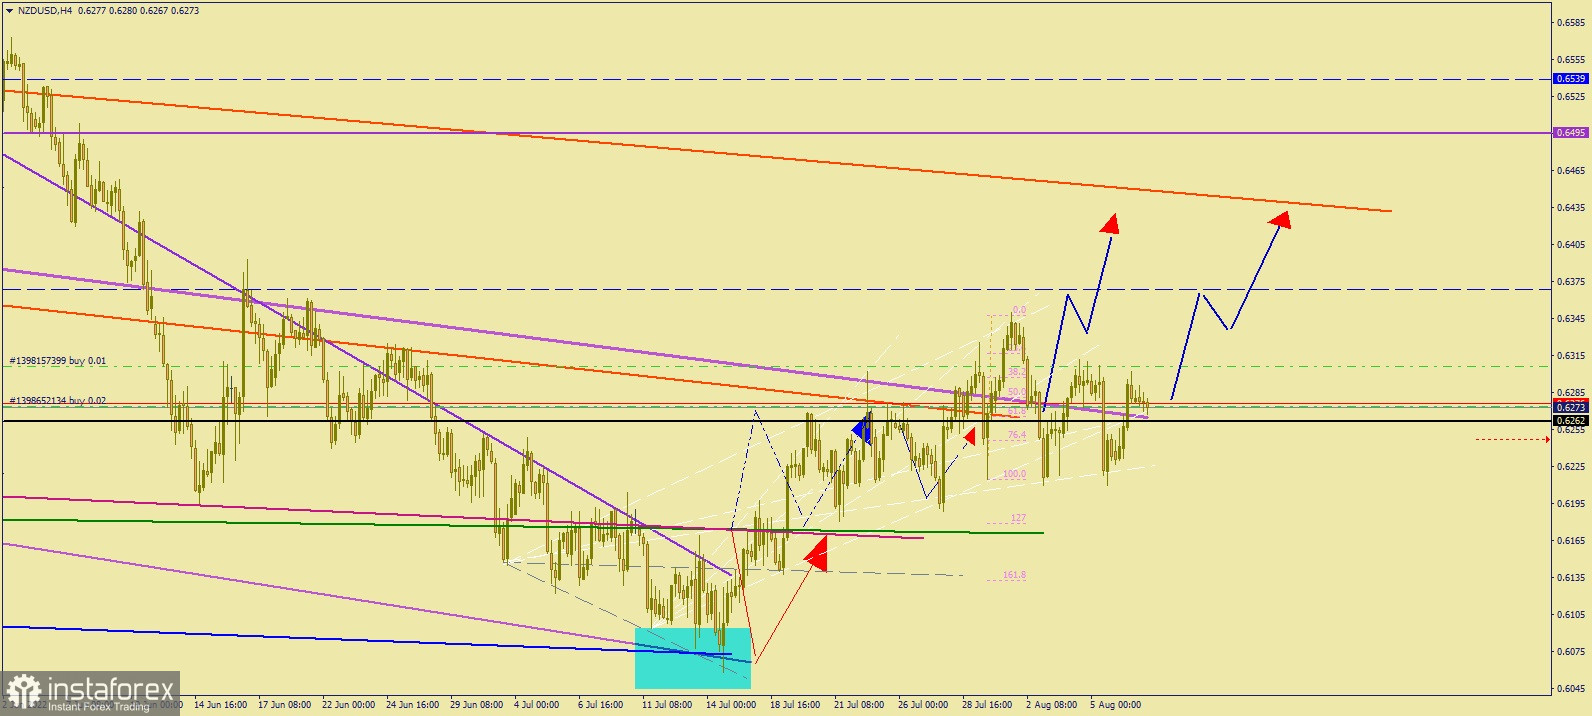
The chart shows the movement of NZD/USD in the four-hour (H4) chart.
Comparing the recent price movement to that of July 15, July 26 and August 2's, it is obvious that the pair continues to aggregate around 0.6262 instead of following the trend. But growth to 0.6435 is still possible as long as 0.6262 remains as a support level. Volatility is likely to be strong in the coming days.
In the case of the breakdown of the support level, expect the trend to change.
Good luck!
 English
 Русский
 Bahasa Indonesia
 Bahasa Malay
 ไทย
ไทย Español
 Deutsch
 Български
 Français
 Tiếng Việt
 中文
中文 বাংলা
বাংলা हिन्दी
 Čeština
 Українська
 Română

