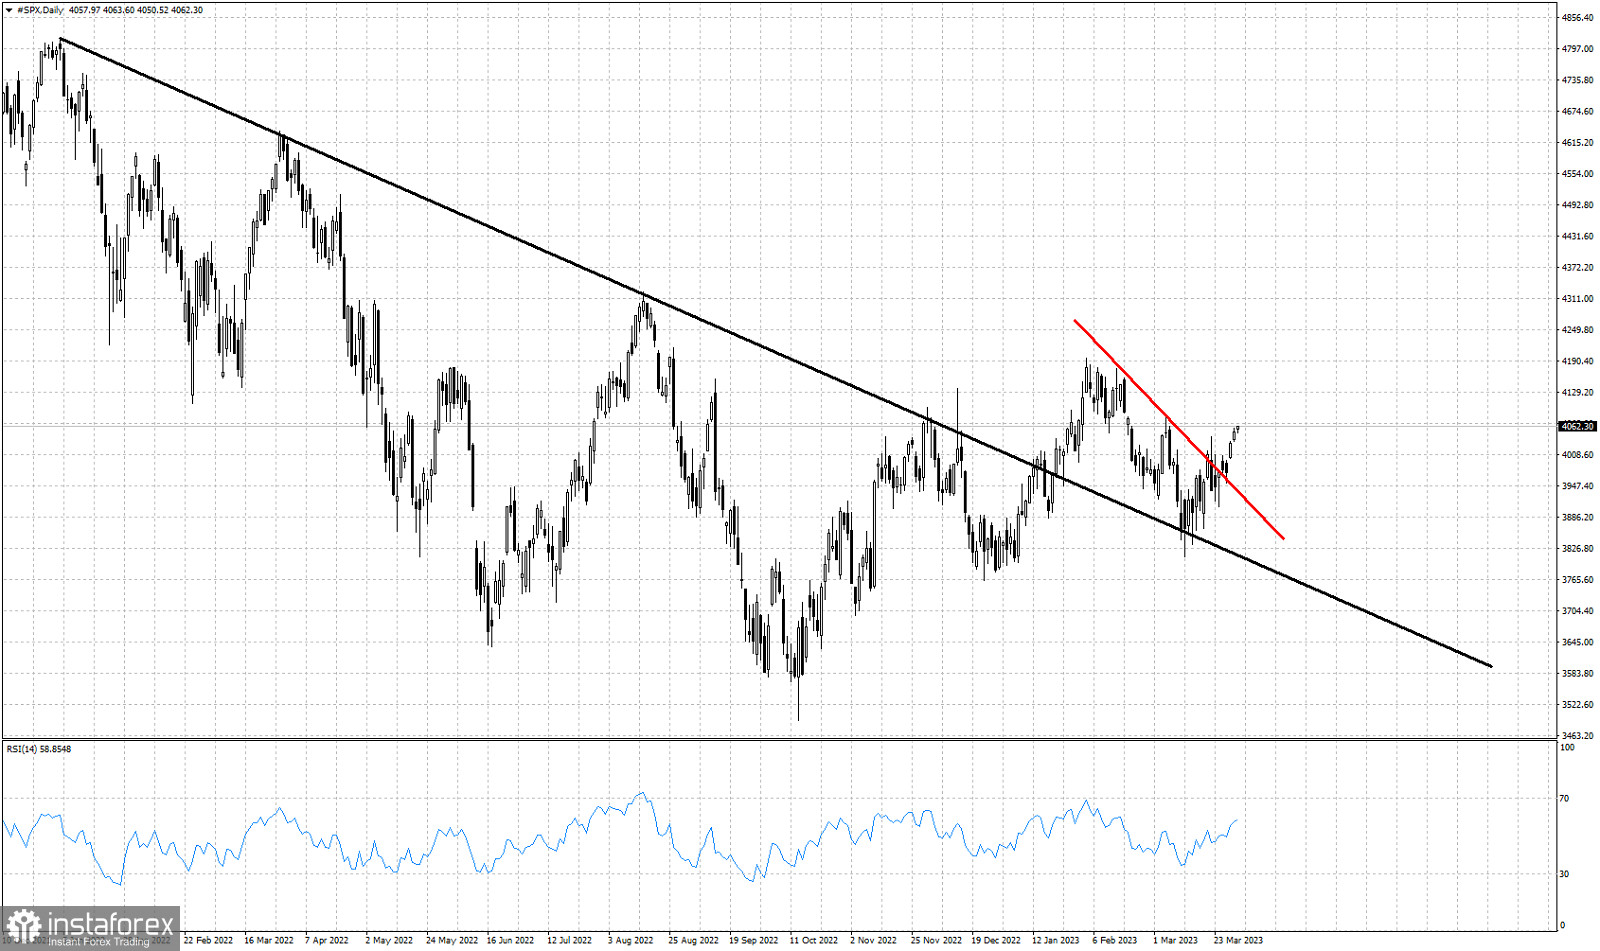
Red line- short-term resistance trend line
Black line- medium-term resistance trend line
SPX is trading around 4,060. Price has now broken above the short-term resistance trend line at 3,960. Price has started making higher highs and higher lows after the back test of the broken medium-term downward sloping trend line (black line). SPX has formed a higher low at 3,809 and is now in the process of bouncing higher. Price is making higher highs and higher lows since the major low of 3490 back in October. As long as price is above the 3,809 level we expect SPX to move at least towards 4250. The RSI is far from overbought levels and with no sign of a bearish divergence in the Daily chart.
 English
 Русский
 Bahasa Indonesia
 Bahasa Malay
 ไทย
ไทย Español
 Deutsch
 Български
 Français
 Tiếng Việt
 中文
中文 বাংলা
বাংলা हिन्दी
 Čeština
 Українська
 Română

