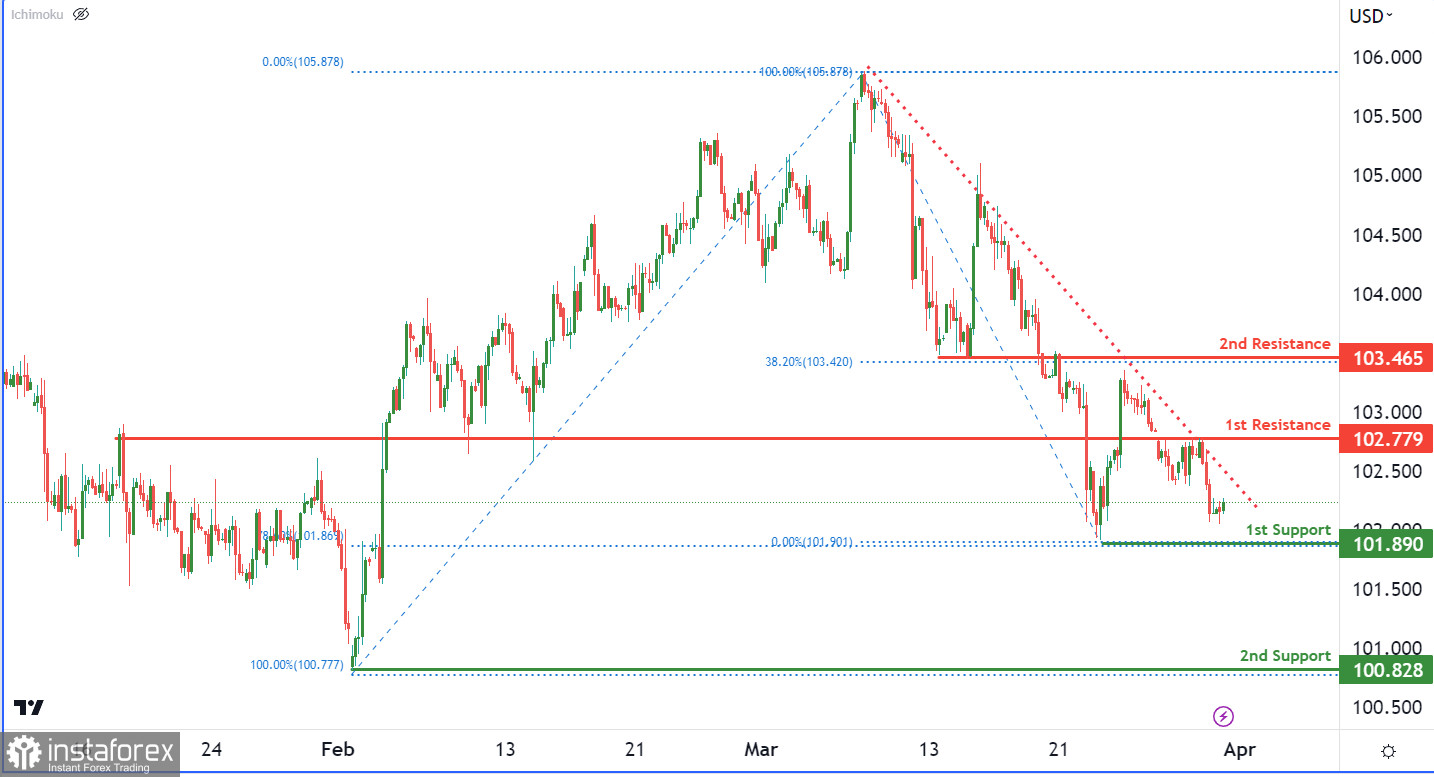
The DXY chart displays bearish momentum, with prices below a significant descending trendline. The first support level at 101.89, a swing low support, coincides with a 78.60% Fibonacci retracement level, making it a strong level to watch. The second support level at 100.82 is also a swing low support. Meanwhile, the first resistance level at 102.77, an overlap resistance, may act as a strong level to watch if prices rise. Breaking through this level could lead to a rise towards the second resistance level at 103.46, an overlap resistance coinciding with a 38.20% Fibonacci retracement level.

 English
 Русский
 Bahasa Indonesia
 Bahasa Malay
 ไทย
ไทย Español
 Deutsch
 Български
 Français
 Tiếng Việt
 中文
中文 বাংলা
বাংলা हिन्दी
 Čeština
 Українська
 Română

