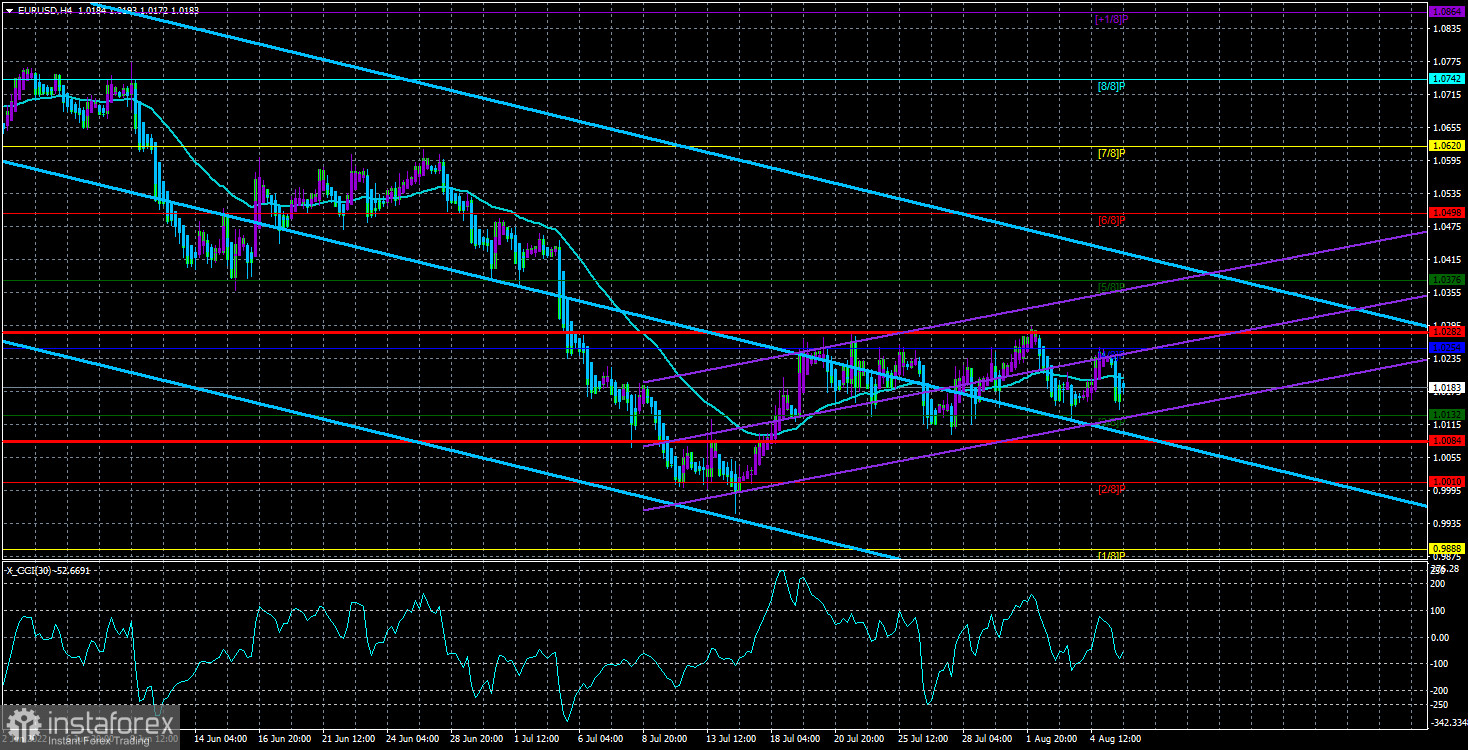
On Friday, EUR/USD moved down in the sideways channel between 3/8 and 4/8 Murrey levels. In other words, the pair is still trading between levels 1.0132 and 1.0254. The flat has been hovering in this sideways range for more than three weeks now and is unlikely to leave it any time soon. The market may stay flat for as long as it takes. It does not necessarily have to end on some important fundamental or macroeconomic event. Even a strong US job report on Friday was not enough for the pair to leave the sideways range. Thus, macro data has little effect on the market in general. So, the pair is still near its 20-year lows. The longer it is here, the higher the possibility of a downtrend. As a reminder, a trend usually ends when quotes bounce and reverse. In our case, neither a bounce nor a reversal has occurred, and the greenback keeps strengthening on fundamentals.
Additional support for the dollar comes from geopolitical factors. The ECB is still lagging behind the US Federal Reserve in terms of its monetary policy. Meanwhile, the global geopolitical situation is getting worse with each new week, which is a positive factor for the safe-haven greenback. Anyway, the dollar is now strong thanks to macroeconomic factors as well. So, the downtrend is likely to resume.
Can recession be avoided?
The latest NFP report shows that Chair Powell may well be right when saying that a recession could be avoided and that the US job market is strong. Although GDP dropped in the first two quarters, there have been no other signs of a recession so far. Perhaps Mr. Powell is right when talking about a modest fall in the US economy after a period of strong growth. In any case, we will get an answer to this question in a few months.
This week, the focus should be on macro reports as they are likely to determine whether EUR/USD will leave the sideways range or not. The key events (the Fed's and the ECB's meetings and NFP) have long gone, and they were not enough to start a new trend in the market. This week, the eurozone will see the release of a single report – June industrial production. Its results will be of secondary importance. In this light, there will be even fewer reasons for the pair to leave the sideways channel. However, as it usually happens, a flat may end when you least expect it. Therefore, it may well be that this week, traders will start to push the price in the direction they want. They may even ignore the US inflation report, scheduled for Wednesday. We see the pair moving in a downtrend as most factors provide support for the dollar. This week, ECB President Lagarde may speak once or twice although her interviews have not been scheduled. However, the ECB can hardly surprise the market after the first 0.50% rate hike in 11 years.

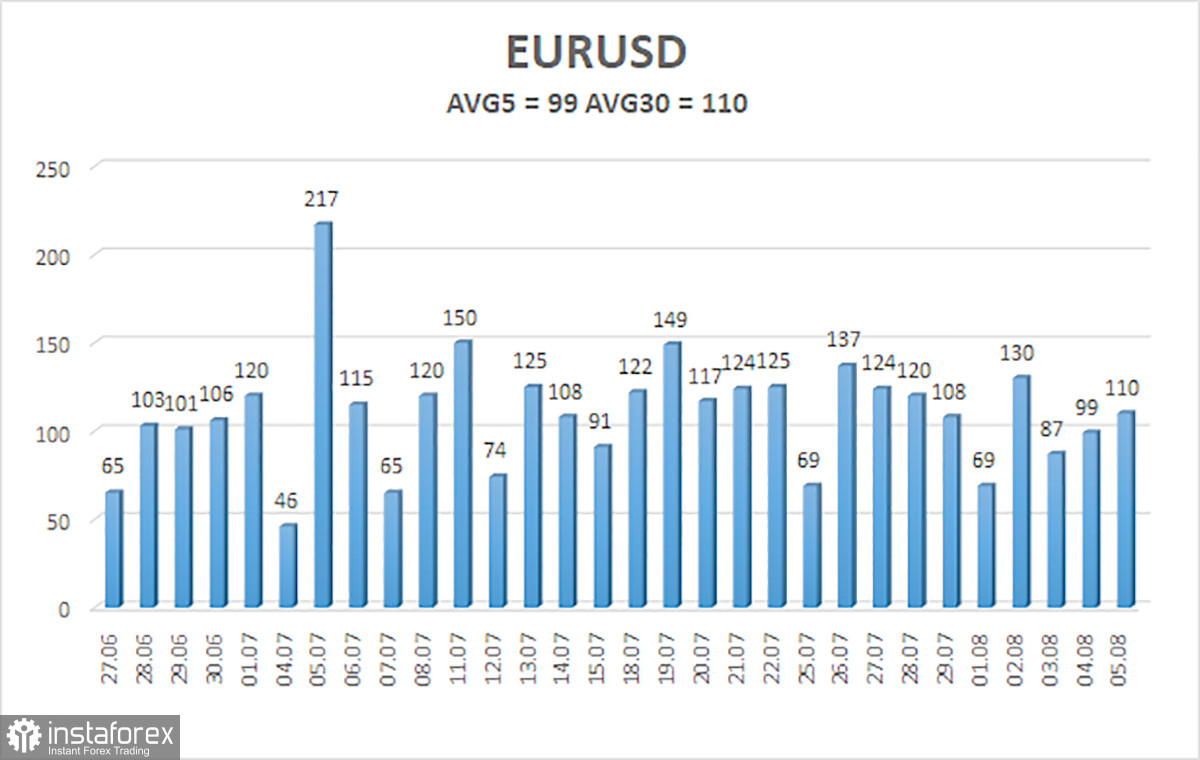
On August 8, the 5-day volatility of EUR/USD totals 99 pips. Today, the pair is likely to move in the range between 1.0084 and 1.0282. Heiken Ashi's upward reversal will indicate a new increase within the sideways range.
Support:
S1 – 1.0132
S2 – 1.0010
S3 – 0.9888
Resistance:
R1 – 1.0254
R2 – 1.0376
R3 – 1.0498
Outlook:
EUR/USD has moved in the sideways range for a month now. So, it is possible to trade after Heiken Ashi's reversals between levels 1.0132 and 1.0254 until the price leaves this channel.
Indicators on charts:
Linear Regression Channels help identify the current trend. If both channels move in the same direction, a trend is strong.
Moving Average (20-day, smoothed) defines the short-term and current trends.
Murray levels are target levels for trends and corrections.
Volatility levels (red lines) reflect a possible price channel the pair is likely to trade in within the day based on the current volatility indicators.
CCI indicator. When the indicator is in the oversold zone (below 250) or in the overbought area (above 250), it means that a trend reversal is likely to occur soon.
 English
 Русский
 Bahasa Indonesia
 Bahasa Malay
 ไทย
ไทย Español
 Deutsch
 Български
 Français
 Tiếng Việt
 中文
中文 বাংলা
বাংলা हिन्दी
 Čeština
 Українська
 Română

