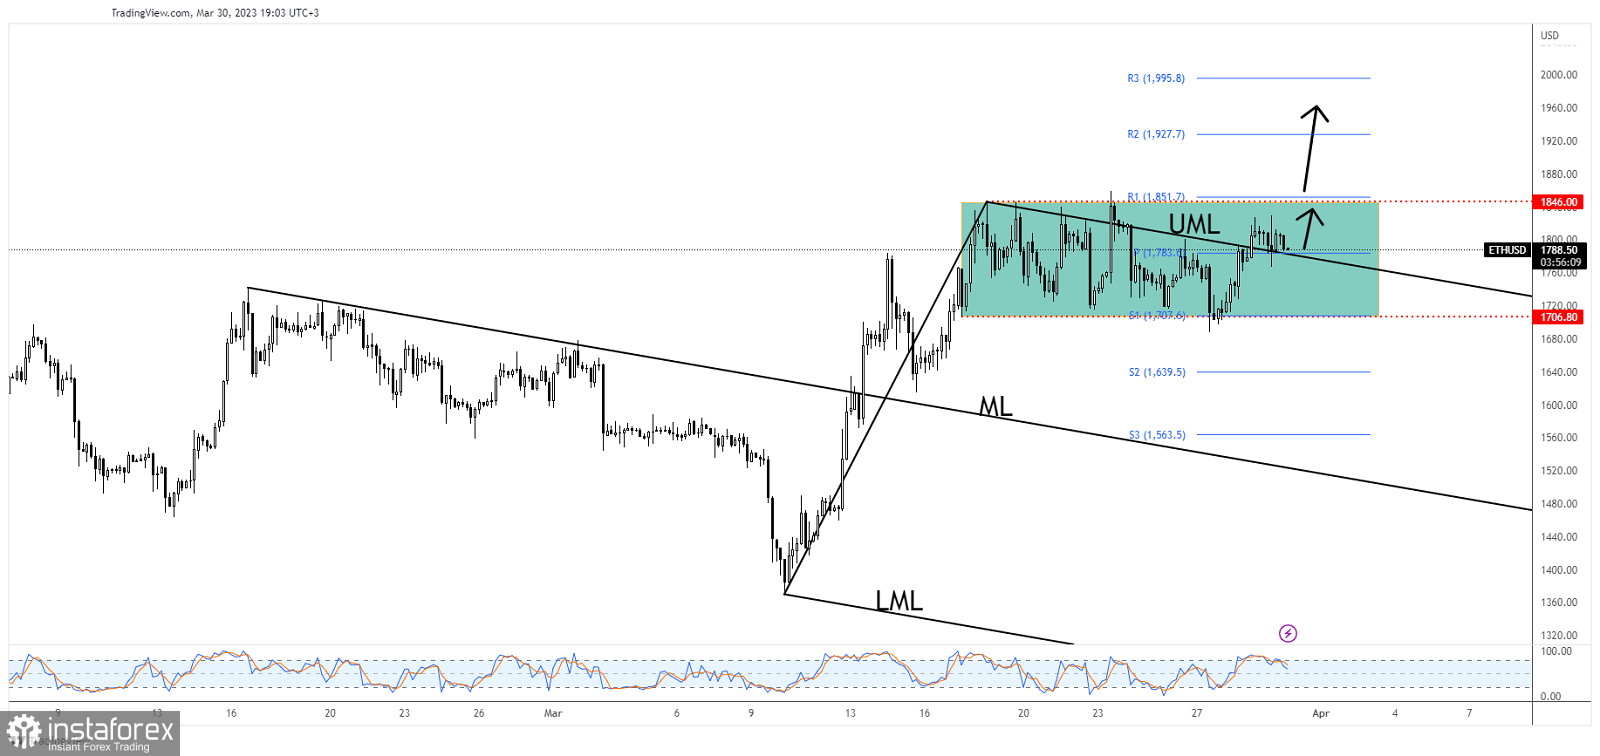
Ethereum continues to move sideways in the short term. It's trading at 1,788 at the time of writing and it seems undecided. The bias is bullish and, so the current range pattern may announce an upside continuation.
ETH/USD increased by 8.41% from Monday's low of 1,687 to 1,829 today's high. In the last 24 hours, the altcoin is down by 1.24% and by 3.16% in the last 7 days.
ETH/USD Bullish Bias!

ETH/USD is trapped between the 1,706 and 1,846 levels. As you can see on the H4 chart, the rate jumped above the descending pitchfork's upper median line (UML) signaling that the retreat ended and that the bulls could take the lead.
Now, it tries to confirm its breakout by testing and retesting the upper median line (UML) and the weekly pivot point (1,783).
ETH/USD Forecast!
A new higher high, a valid breakout through 1,846 validates further growth and is seen as a buying opportunity.
 English
 Русский
 Bahasa Indonesia
 Bahasa Malay
 ไทย
ไทย Español
 Deutsch
 Български
 Français
 Tiếng Việt
 中文
中文 বাংলা
বাংলা हिन्दी
 Čeština
 Українська
 Română

