English
  Русский
 Bahasa Indonesia
 Bahasa Malay
 ไทย
ไทย Español
 Deutsch
 Български
 Français
 Tiếng Việt
 中文
中文 বাংলা
বাংলা हिन्दी
 Čeština
 Українська
 Română

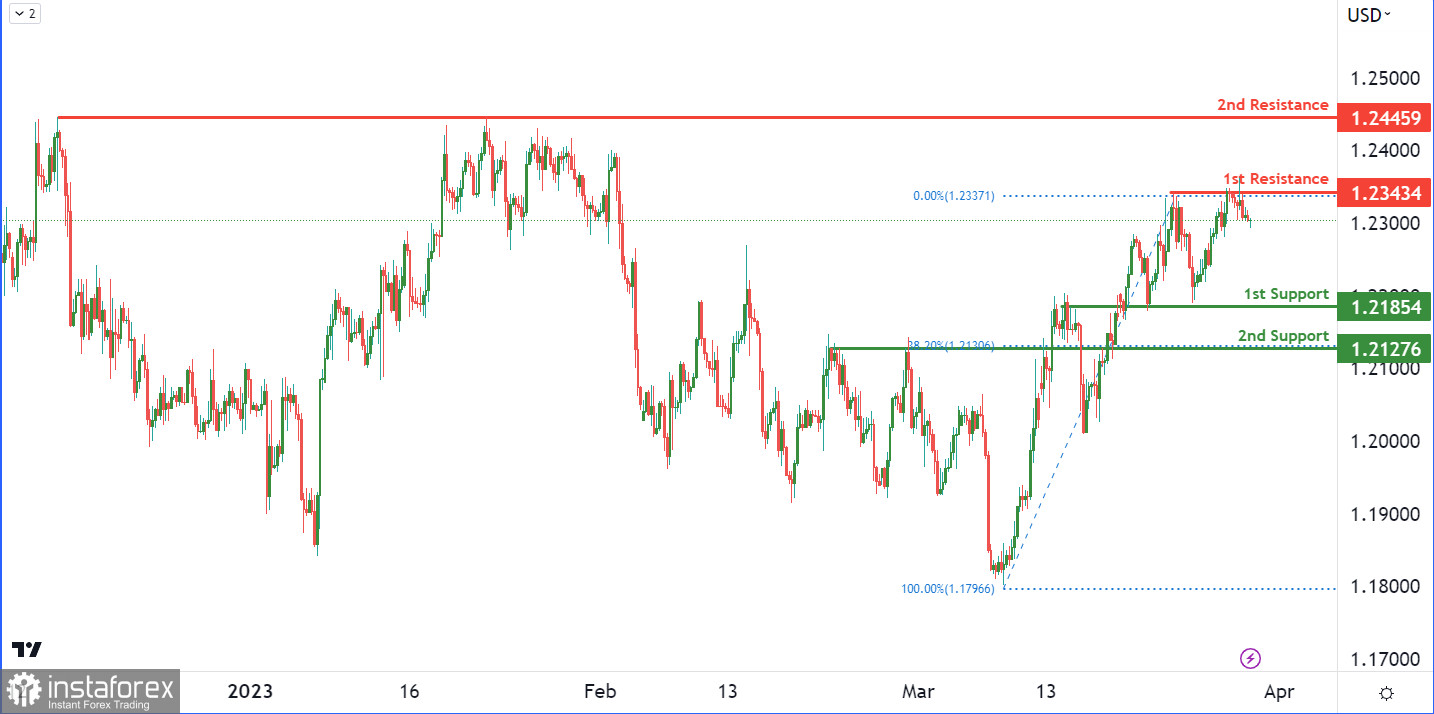
The GBP/USD chart shows a bearish momentum, indicating the possibility of price continuing its decline towards the first support level. Presently, the price is testing the first resistance level at 1.2343, which is a multi-swing high resistance level. A failure to break through this resistance could initiate a bearish move towards the first support level at 1.2185. This level is a robust overlap support, confluencing with a 38.20% Fibonacci retracement.
If the first support level is broken, the price could sustain its bearish momentum towards the second support at 1.2127. This level is also an overlap support and has a 38.20% Fibonacci retracement lining up with it. On the way up, there are two strong resistance levels, with the first being 1.2343, as mentioned before, and the second at 1.2445, which is a multi-swing high resistance level.