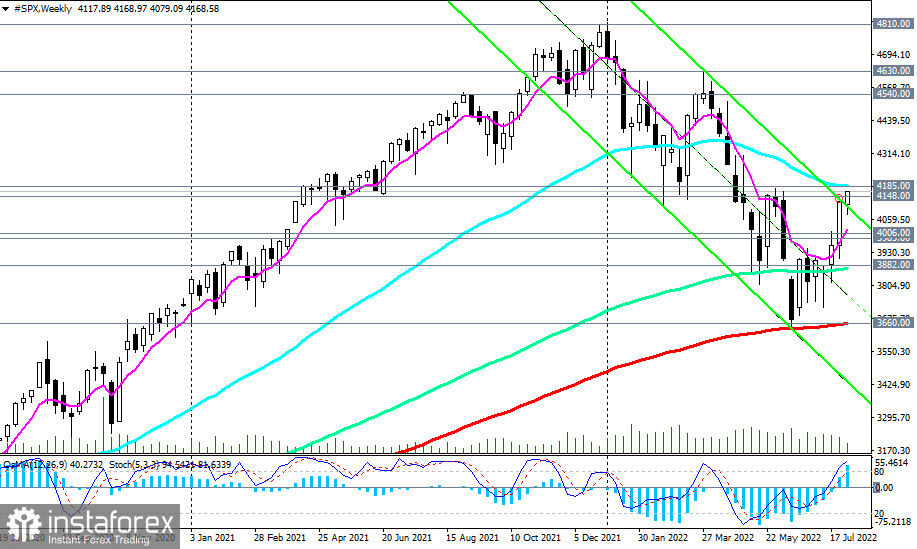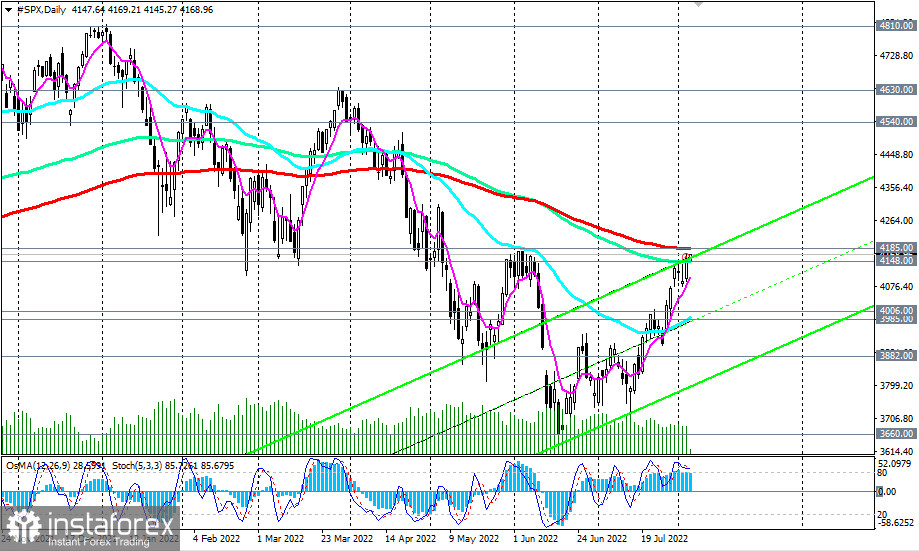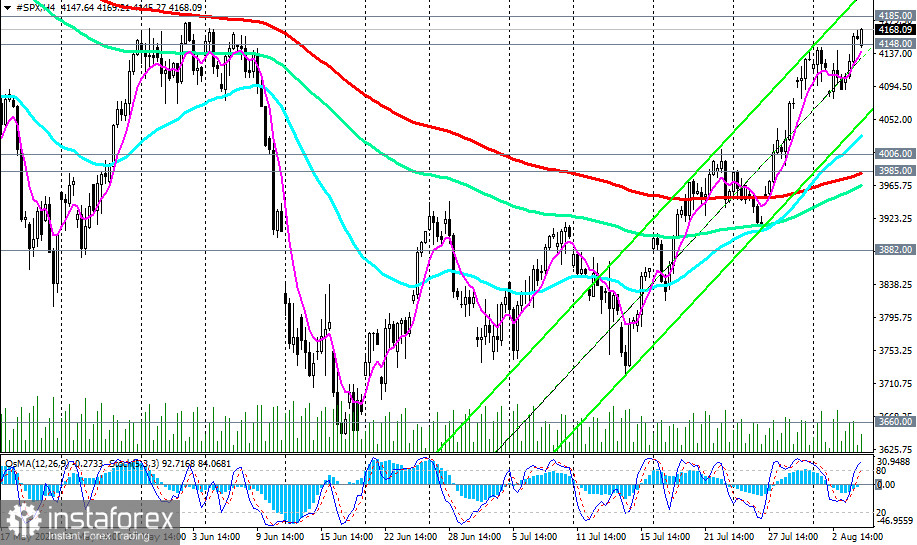
The US S&P 500 broad market index (reflected as CFD #SPX in the trading terminal) broke through a strong resistance level of 4148.00 yesterday (144 EMA and the upper line of the ascending channel on the daily chart) and today came close to the key long-term resistance level of 4185.00 (200 EMA on the daily chart, 50 EMA on the weekly chart).

As of this writing, S&P 500 CFDs are trading near the 4167.00 mark, continuing to correct after the strongest drop since the beginning of the year to the key support level of 3660.00, separating the long-term bullish trend from the bearish one.
In the event of a breakdown of the 4185.00 resistance level, the S&P 500 will head towards all-time highs near the 4810.00 mark reached earlier this year, which will also indicate a full recovery of the multi-year bullish trend of the S&P 500.

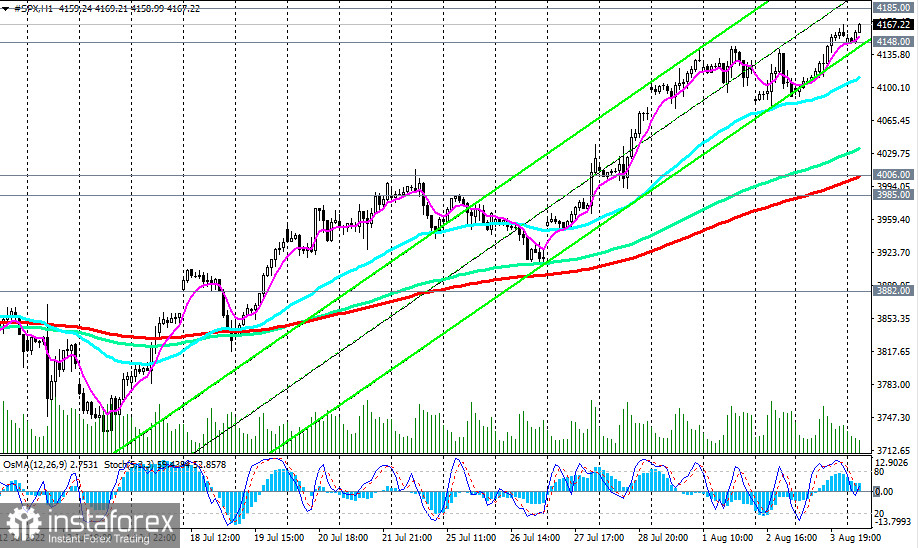
In an alternative scenario, and after the breakdown of support levels 4006.00 (200 EMA on the 1-hour chart), 3985.00 (200 EMA on the 4-hour chart, 50 EMA on the daily chart), the S&P 500 will again head towards the key long-term support level 3660.00 (200 EMA on the weekly chart), separating a long-term bullish trend from a bearish one. Its breakdown may finally break the long-term global bullish trend of the S&P 500 and, perhaps, the entire American stock market.
The first and trial signal for the implementation of this scenario will be the decline of the S&P 500 to the area below the support level 4148.00.

Support levels: 4148.00, 4006.00, 3985.00, 3882.00, 3660.00, 3600.00
Resistance levels: 4185.00, 4540.00, 4630.00, 4810.00
Trading Tips
Sell Stop 4075.00.00. Stop-Loss 4175.00. Take-profit 4006.00, 3985.00, 3882.00, 3660.00, 3600.00
Buy Stop 4175.00. Stop-Loss 4075.00. Take-profit 4185.00, 4540.00, 4630.00, 4810.00
 English
 Русский
 Bahasa Indonesia
 Bahasa Malay
 ไทย
ไทย Español
 Deutsch
 Български
 Français
 Tiếng Việt
 中文
中文 বাংলা
বাংলা हिन्दी
 Čeština
 Українська
 Română

