The first day of August is going to be interesting in terms of the economic calendar. It is not common for Monday. Nevertheless, revised manufacturing PMIs that will be published by the Markit research group will be of little importance. The final PMIs are likely to match flash estimates that have been already priced in by the market. German retail sales are another thing. Retail salesare expected to shrink to a larger degree in June which could dampen market sentiment on the euro. To make things worse, the unemployment rate in the eurozone is projected to edge up to 6.7% from 6.6%. by and large, the single European currency is set to lose ground.
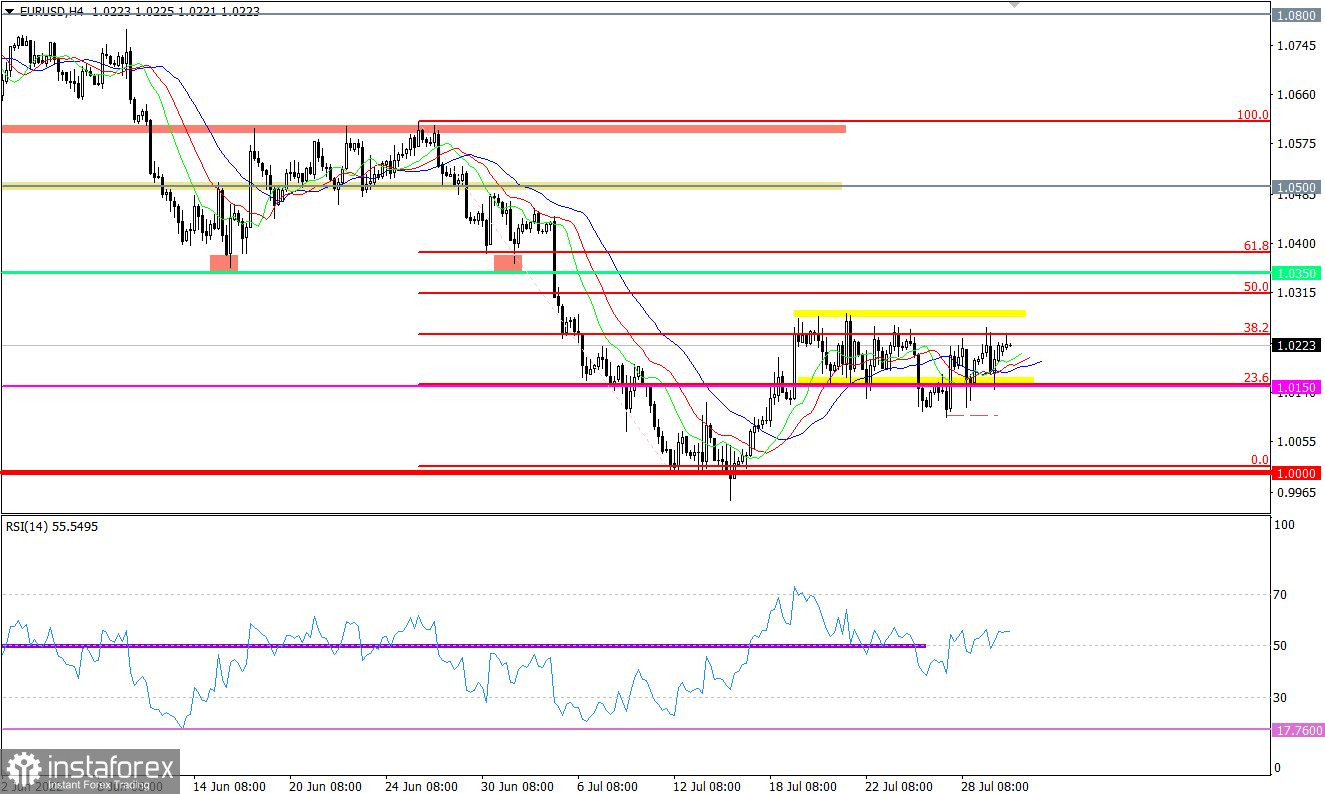
EUR/USD has been trading sideways for the second week in a row. It has trapped between 1.0150 and 1.0270, oscillating between the upper and lower borders in a regular pattern. The range-bound market reflects mixed sentiment among market participants.
The H4 RSI technical instrument has been moving along the threshold of 50 which corresponds to flat trading. The D1 RSI has approached the 50 line, though it doesn't pass it upwards. It means that the market has not changed yet trading sentiment from selling to buying. Moving averageson the Alligator indicator look similar to RSI. On the 4-hour chart, moving averages are indicating the flat market because they are not intersected with one another. Besides, moving averages of the D1 Alligator are directed downwards and are not intersected as well.

Outlook and trading tips
Under the current market conditions, traders are planning their work according to twostrategies: trading on bounces and dips within the range and a breakout strategy.Let's discuss each of the methods.
A dip from the upper border means the fight between the bulls and bears at the 1.0250/1.2070 area where the price might reverse its direction. The price could bounce off the lower border at about 1.0150.
Speaking about a breakout strategy, traders should monitor the pivot point of 1.0300 in case the price breaks the upper border upwards as well as 1.0100 in case of the alternative downward scenario. Importantly, the fact of a breakout of any of the borders should be confirmed at least on the 4-hour chart, i.e. the price should settle beyond the above-said said pivot points.
Complex indicator analysis suggests buying for the short term and for intraday trading because the price is approaching the upper border of the trading range. Technical indicators still signal the downtrend for the medium term.
 English
 Русский
 Bahasa Indonesia
 Bahasa Malay
 ไทย
ไทย Español
 Deutsch
 Български
 Français
 Tiếng Việt
 中文
中文 বাংলা
বাংলা हिन्दी
 Čeština
 Українська
 Română

