Technical Market Outlook:
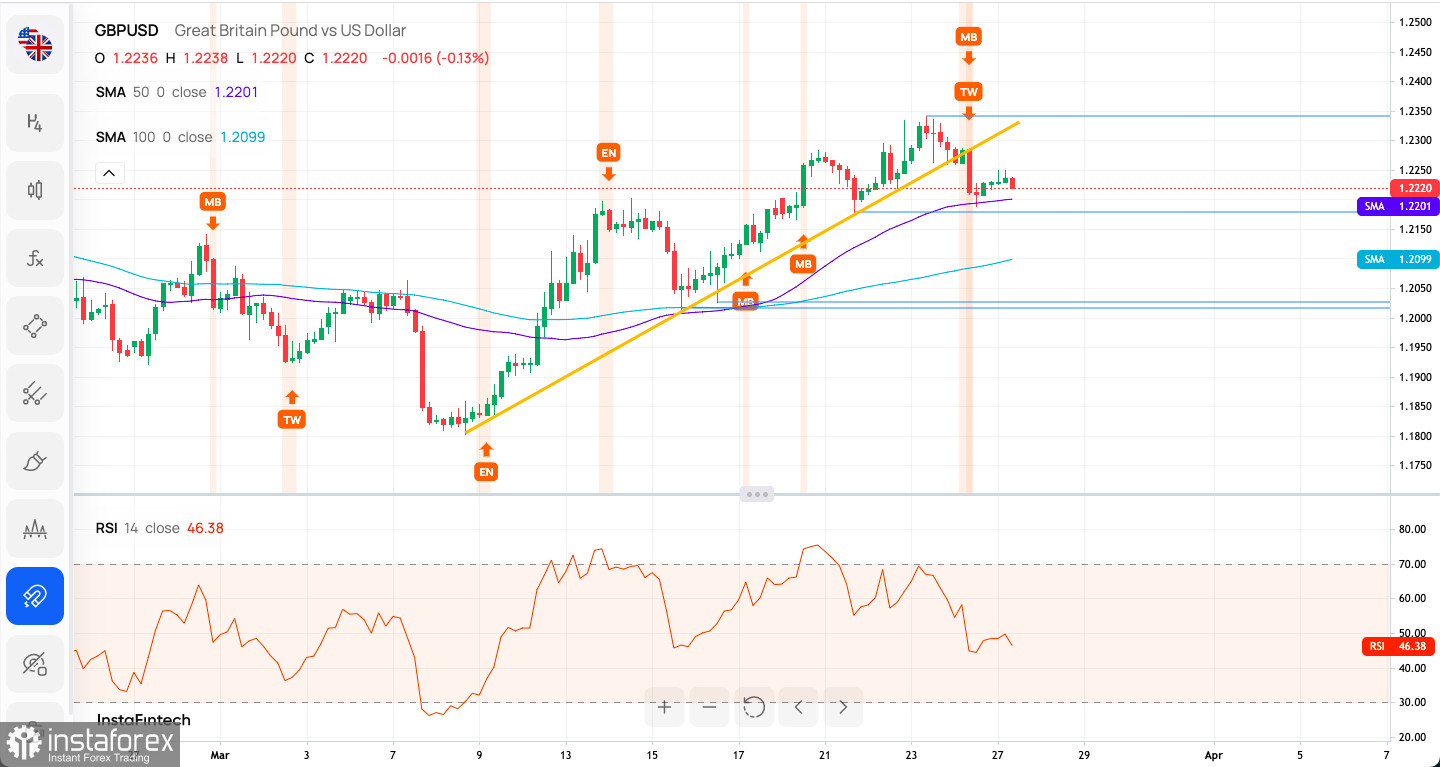
The GBP/USD pair has broken below the short-term trend line support and made a new local low at the level of 1.2189 ( at the time of writing the analysis). The momentum is weak and negative, which indicates the bears are in control of this market and the next target for bears is seen at the level of 1.2200 and 1.2026. The intraday technical support is seen at 1.2178 and the intraday technical resistance is located at 1.2262. Any breakout below the 50 MA seen around the level of 1.2201 will accelerate the correction pace towards the lower levels like 100 MA located at 1.2036.

Weekly Pivot Points:
WR3 - 1.22794
WR2 - 1.22587
WR1 - 1.22462
Weekly Pivot - 1.2238
WS1 - 1.22255
WS2 - 1.22173
WS3 - 1.21966
Trading Outlook:
So far the level of 1.2443 was too strong resistance to break through, so a potential Double Top price pattern is still in play. Moreover, the level of 1.2297 which is 50% Fibonacci retracement level of the last big wave down had been hit, so the bears resumed the down trend. The down trend was confirmed with the level of 1.2089 breakout (50 WMA), so now the potential target for bears is seen at the level of 1.1840 or below.
 English
 Русский
 Bahasa Indonesia
 Bahasa Malay
 ไทย
ไทย Español
 Deutsch
 Български
 Français
 Tiếng Việt
 中文
中文 বাংলা
বাংলা हिन्दी
 Čeština
 Українська
 Română

