Gold:

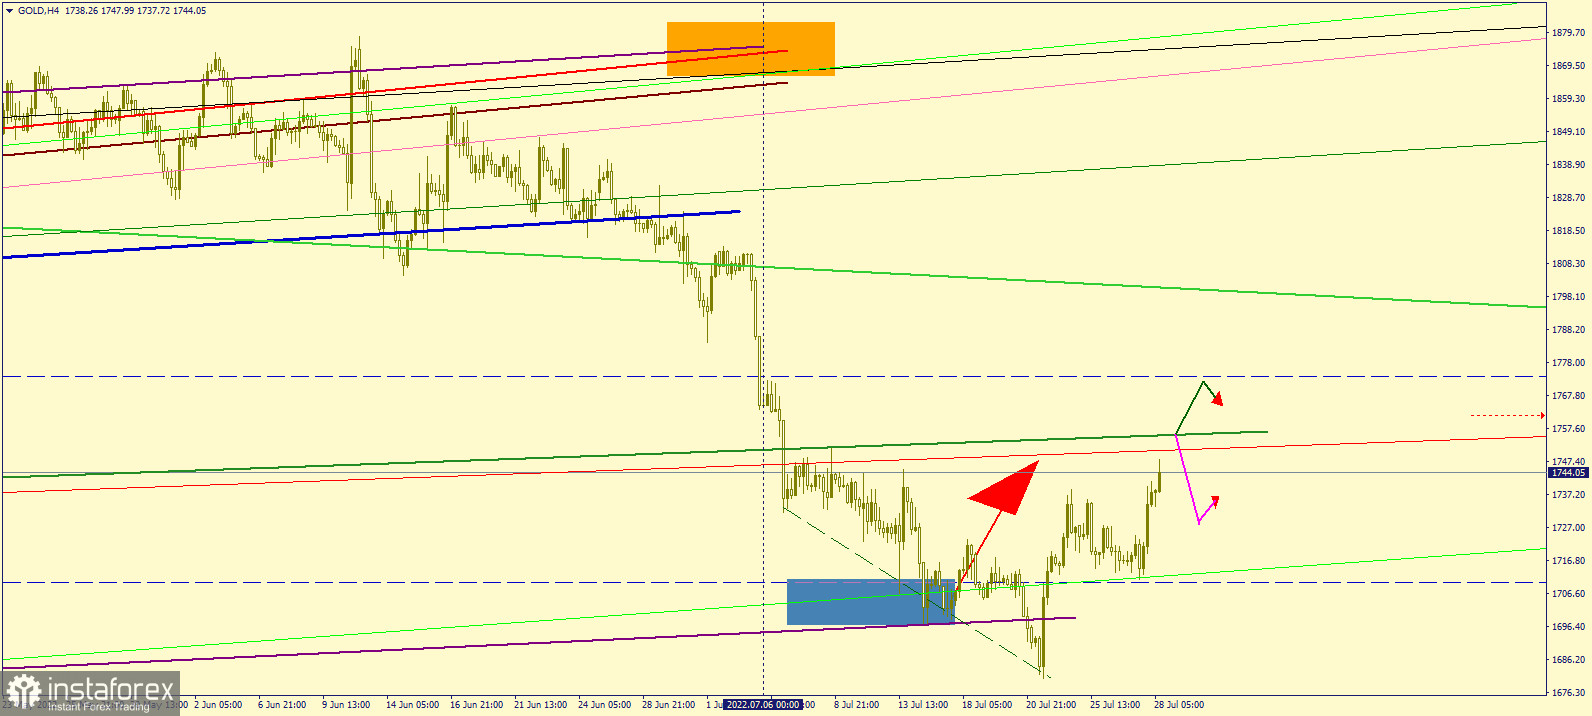
The chart shows the movement of gold in the four-hour (H4) chart.
Comparing the recent movement to that of June 13's, it is clear that the resistance level of $1755.0 is very important for a further price increase. Most likely, there will be a correction to $1727.0 if this level is broken. The breakout will also convince traders to a growth towards a new target of $1772.0 per 1 troy ounce.
 English
 Русский
 Bahasa Indonesia
 Bahasa Malay
 ไทย
ไทย Español
 Deutsch
 Български
 Français
 Tiếng Việt
 中文
中文 বাংলা
বাংলা हिन्दी
 Čeština
 Українська
 Română

