Technical Market Outlook:
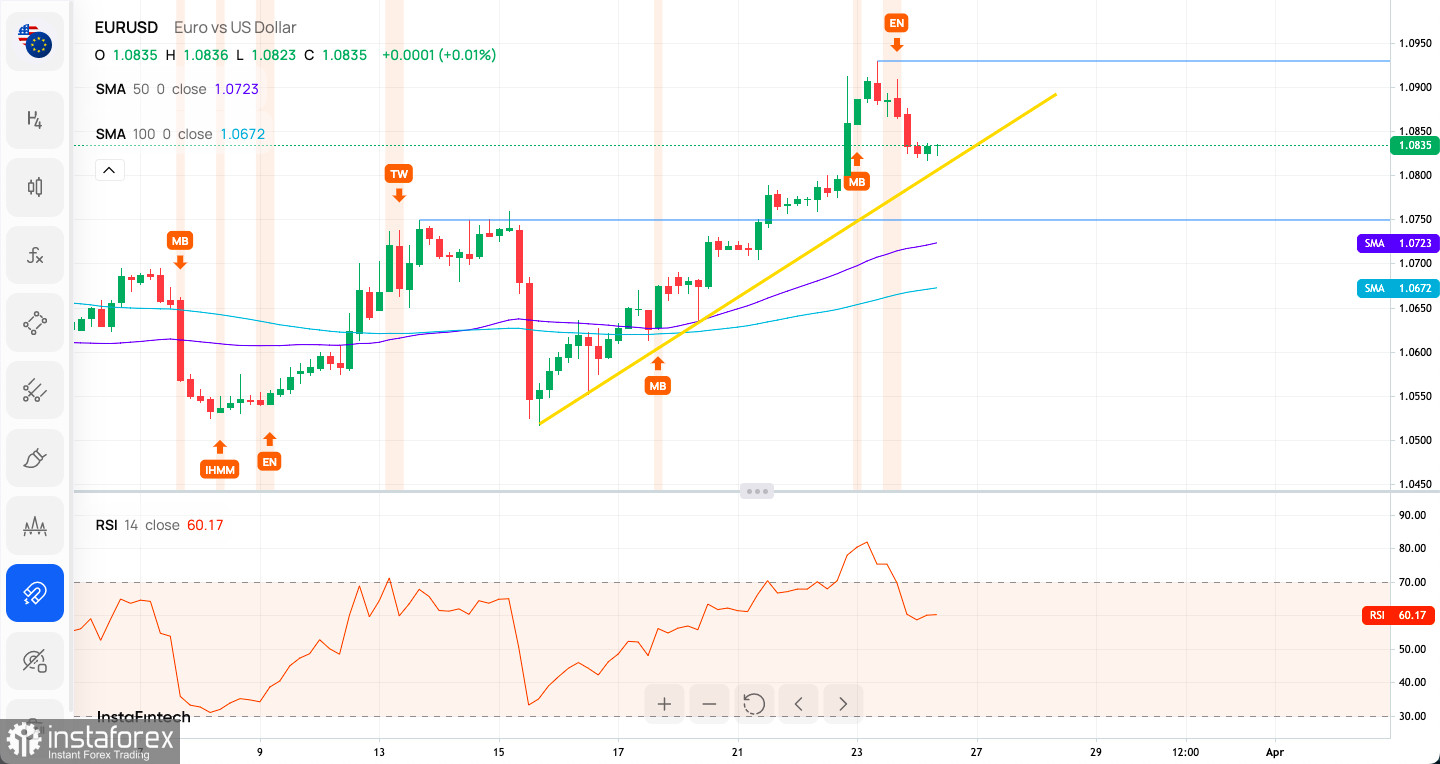
The EUR/USD pair has made a new swing high at the level of 1.0930 and the rally was capped at the level due to the extremely overbought market conditions on the H4 time frame chart. After the Bearish Engulfing candlestick pattern was made at the H4 time frame chart, the EUR started the corrective cycle. The intraday technical support is seen at the level of 1.0789 and the intraday technical resistance is located at 1.0940, but in a case of a breakout, the next target for bulls is seen at the level of 1.1033 (swing high from Feb 2). The strong and positive momentum on the H4 time-frame chart support the short-term bullish outlook for EUR, however the market conditions are now extremely overbought on this time frame.

Weekly Pivot Points:
WR3 - 1.07258
WR2 - 1.07006
WR1 - 1.06865
Weekly Pivot - 1.06754
WS1 - 1.06613
WS2 - 1.06502
WS3 - 1.06250
Trading Outlook:
Since the beginning of October 2022 the EUR/USD is in the corrective cycle to the upside, but the main, long-term trend remains bearish. This corrective cycle might had been terminated at the level of 1.1033 which is 50% Fibonacci retracement level. The EUR had made a new multi-decade low at the level of 0.9538, so as long as the USD is being bought all across the board, the down trend will continue towards the new lows.
 English
 Русский
 Bahasa Indonesia
 Bahasa Malay
 ไทย
ไทย Español
 Deutsch
 Български
 Français
 Tiếng Việt
 中文
中文 বাংলা
বাংলা हिन्दी
 Čeština
 Українська
 Română

