USD/JPY:

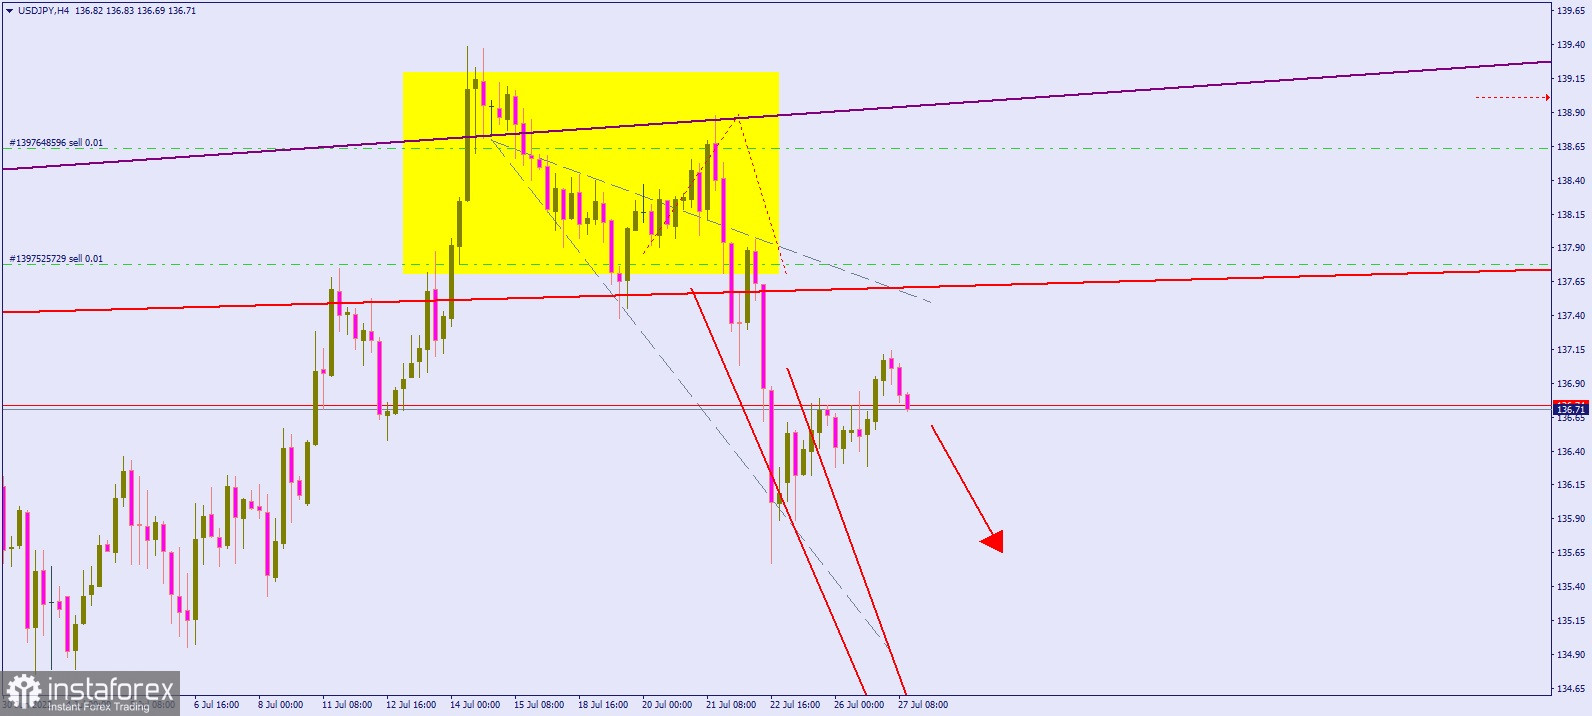
The chart shows the movement of USD/JPY in the four-hour (H4) chart.
Comparing the recent movement to that of June 19's, it is clear that the pair continued to decline, extending the downward trend that has been going on for days. The nearest target is £135.65 for $1.
 English
 Русский
 Bahasa Indonesia
 Bahasa Malay
 ไทย
ไทย Español
 Deutsch
 Български
 Français
 Tiếng Việt
 中文
中文 বাংলা
বাংলা हिन्दी
 Čeština
 Українська
 Română

