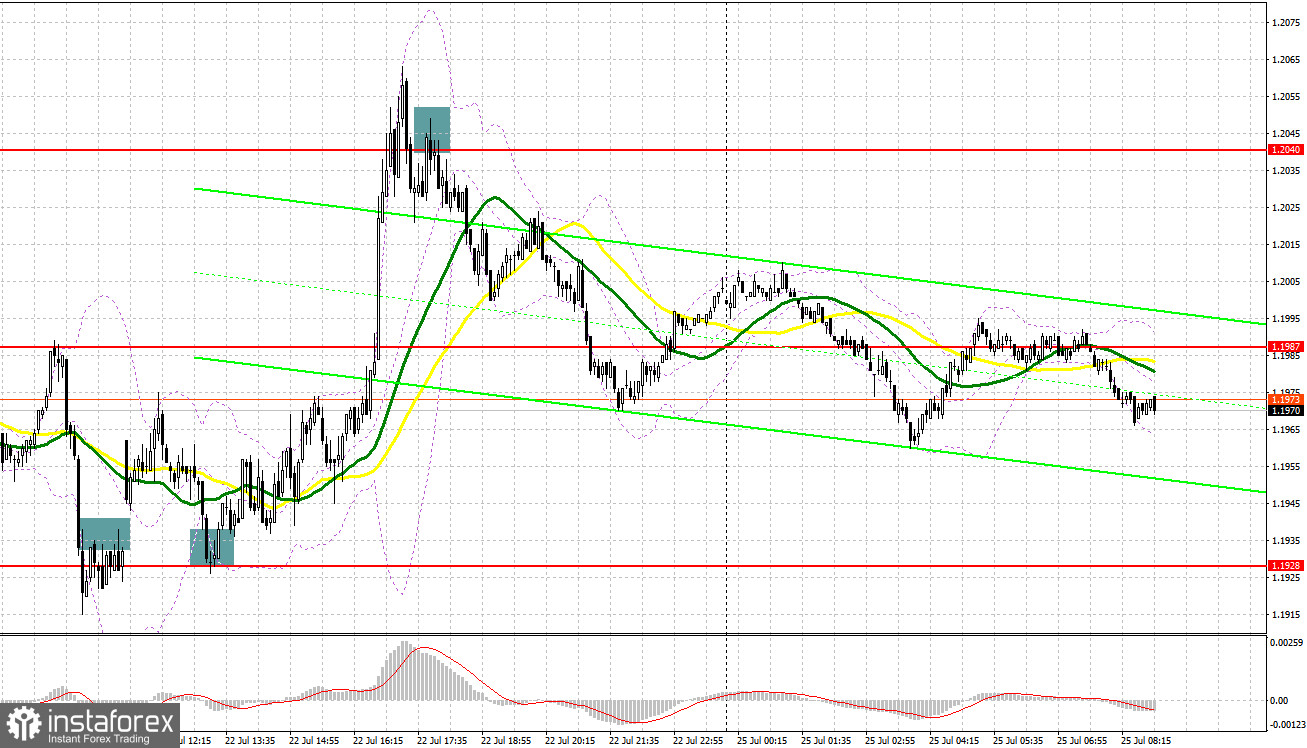
On Friday, there were several entry points. Let's look at the 5-minute chart and try to figure out what actually happened. In the morning article, I highlighted the level of 1.1933 and recommended making decisions with this level in focus. A sell signal appeared after a breakout and an upward test of the support level of 1.1933 in the first half of the day. However, upbeat UK PMI indexes data limited the downward potential. As a result, traders had to close stop-loss orders and wait for new signals. A return to 1.1933 and a downward test of this level gave a buy signal. The pair managed to climb to 1.2040, enabling speculators to obtain more than 100 pips of profit. In the second half of the day, a false breakout and a drop below 1.2240 provided an excellent entry point from the weekly high into short positions. The pair declined by 60 pips.

What is needed to open long positions on GBP/USD
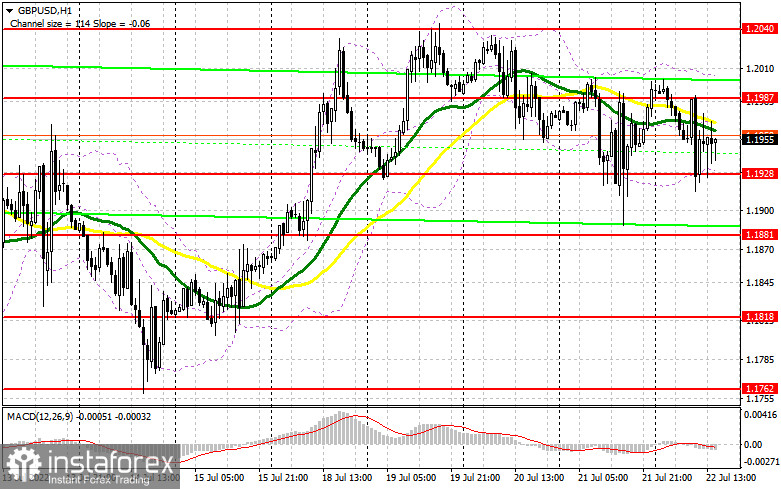
Today there are no fundamental factors that could affect the trajectory of the pound sterling and help it to escape the sideways channel. Therefore, it is better to make trading decisions from the nearest levels. The Confederation of British Industry's order book balance is on tap today. This report may escalate pressure on the pair. If so, the pair is likely to dip to the new support level of 1.1941. It is recommended to open long positions at this level. The optimal scenario for opening long positions will be a false breakout of 1.1941. In this case, the price is projected to grow to the resistance level of 1.1994. Last Friday, the pound sterling failed to reach this level despite a rapid rise. The breakout of this level will open the way to a weekly high of 1.2040. A breakout of 1.2040 and a downward test will facilitate a robust upward momentum. In this case, a buy signal will appear with the prospect of a jump to 1.2081. If the price breaks above this level, it is likely to approach 1.2119 where I recommend locking in profits. If GBP/USD falls and bulls show no activity at 1.1941, the pound sterling will face strong bearish pressure. If this scenario comes true, it is recommended to postpone long positions until a false breakout of 1.1893. You can buy GBP/USD immediately after a bounce from 1.1851 or even a low of 1.1808, keeping in mind an upward intraday correction of 30-35 pips.
What is needed to open short positions on GBP/USD
The bears defended the physiologically important level of 1.2040 with flying colors last Friday. So, the pair ended the week below 1.1994. It signals a strong bearish bias in the market and anticipation of another sell-off. Traders could also expect the pound sterling to drop to yearly lows after the Fed meeting. Today, the bears will have to do everything possible to keep GBP/USD below 1.1994. The optimal scenario for opening short positions will be a false breakout after the release of fresh macro statists. Analysts predict that the report is likely to be weak. If this assumption is correct, the pair will resume a downward movement. So, it may dip to the support level of 1.1941, formed last Friday. A breakout and an upward test of 1.1941 will generate a sell signal. The price is likely to slip to 1.1893. It is recommended to partially lock in profits at this level. A more distant target will be the 1.1851 level but this may occur under the worst-case scenario. IF GBP/USD rises and bears show no energy at 1.1994 in the first half of the day, the bulls will regain the upper hand. If so, it is better to postpone short positions. Only a false breakout near the weekly high of 1.2040 will give a sell signal with the prospect of a pullback. If the bears do not make attempts to push the pair down at this level, the price may perform an upward reversal. If so, it is recommended to postpone short positions until 1.2081 and 1.2119. At these levels, you can sell GBP/USD after an intraday pullback by 30-35 pips.

COT report
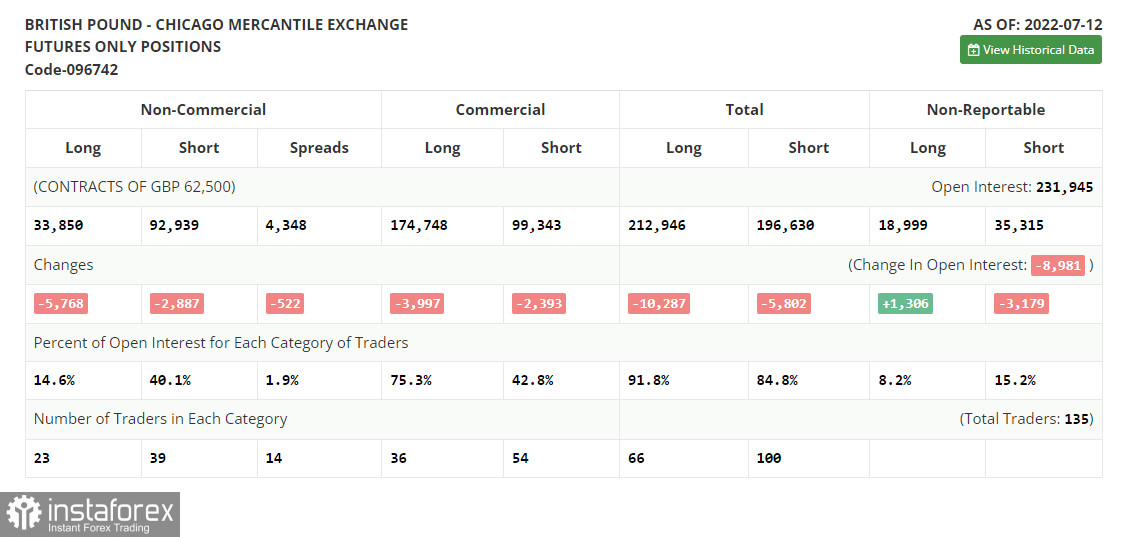
The COT report (Commitment of Traders) for July 12 logged a drop in both short and long positions. However, the number of short positions exceeded the number of long ones, which increased the negative delta. The bulls tried to push the price above the yearly lows but failed. By the end of the week traders began to lock in profits following strong US macro stats. It led to a slight correction of the pound sterling, which trades had been anticipating for a long time. Inflation in the UK is accelerating rapidly. The government is unable to curb it. At the same time, the Fed sticks to its aggressive monetary tightening. The next rate increase is expected to be almost 1.0%. Such expectations are bullish for the US dollar, while the pound sterling is, on the contrary, declining. The COT revealed that the number of long non-commercial positions dropped by 5,768 to 33,850, while the number of short non-commercial positions slipped by 2,887 to 92,939. It triggered an increase in the negative delta of the non-commercial net position to -59,089 from 56,208. The weekly closing price edged lower to 1.1915 against 1.1965.

Signals of technical indicators
Moving averages
GBP/USD is trading near 30- and 50-period moving averages. It means that the price is moving in the sideways channel.
Remark. The author is analyzing the period and prices of moving averages on the 1-hour chart. So, it differs from the common definition of classic daily moving averages on the daily chart.
Bollinger Bands
In case of a rise, the 1.2040 level will act as a resistance. In case of a decline, the lower border at 1.1941 will act as support.
Definitions of technical indicators
- Moving average recognizes an ongoing trend through leveling out volatility and market noise. A 50-period moving average is plotted yellow on the chart.
- Moving average identifies an ongoing trend through leveling out volatility and market noise. A 30-period moving average is displayed as the green line.
- MACD indicator represents a relationship between two moving averages that is a ratio of Moving Average Convergence/Divergence. The MACD is calculated by subtracting the 26-period Exponential Moving Average (EMA) from the 12-period EMA. A 9-day EMA of the MACD called the "signal line".
- Bollinger Bands is a momentum indicator. The upper and lower bands are typically 2 standard deviations +/- from a 20-day simple moving average.
- Non-commercial traders - speculators such as retail traders, hedge funds and large institutions who use the futures market for speculative purposes and meet certain requirements.
- Non-commercial long positions represent the total long open position of non-commercial traders.
- Non-commercial short positions represent the total short open position of non-commercial traders.
- The overall non-commercial net position balance is the difference between short and long positions of non-commercial traders.
 English
 Русский
 Bahasa Indonesia
 Bahasa Malay
 ไทย
ไทย Español
 Deutsch
 Български
 Français
 Tiếng Việt
 中文
中文 বাংলা
বাংলা हिन्दी
 Čeština
 Українська
 Română

