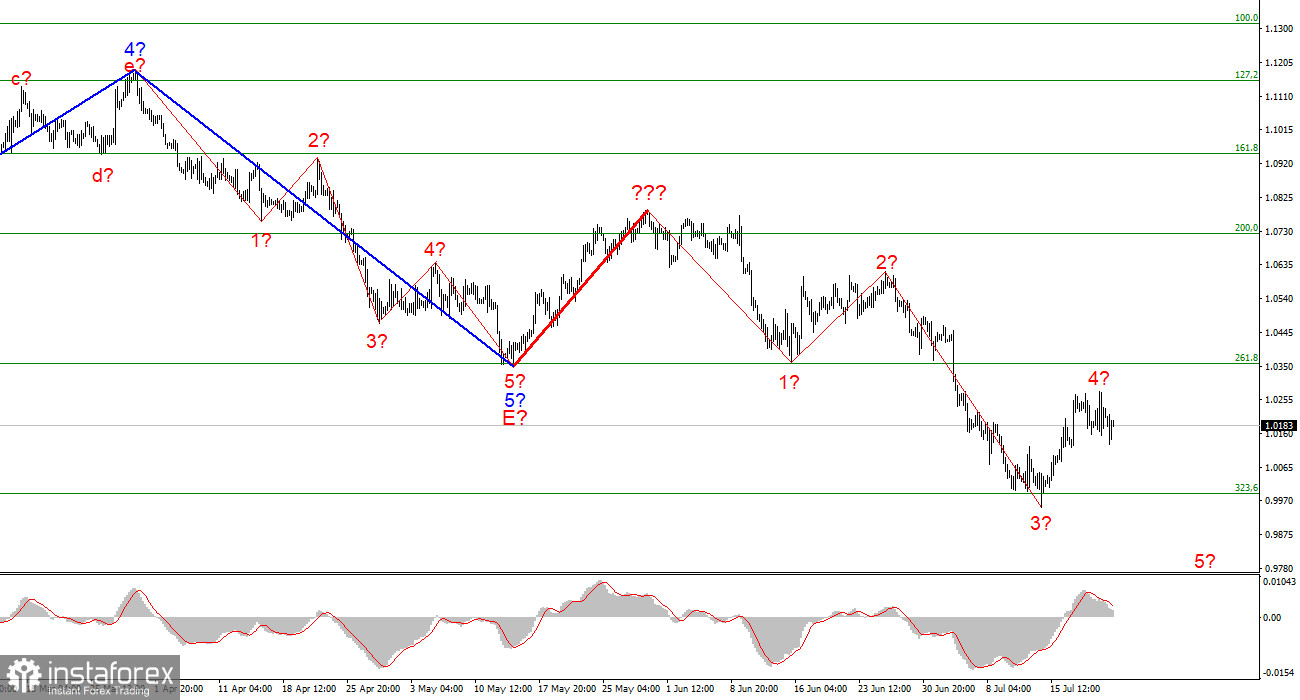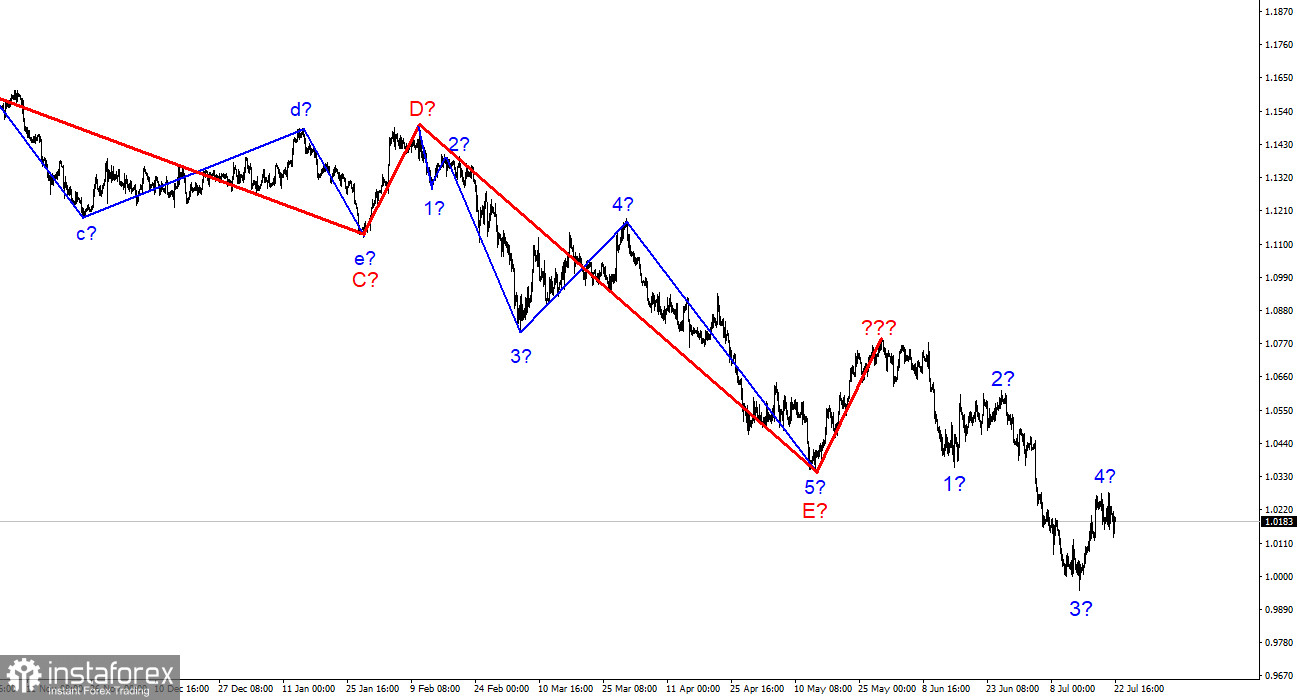
A few weeks ago, the wave markings on the 4-hour chart for the euro/dollar instrument got more complex and no longer had a holistic appearance. There was a successful attempt to break through the 261.8 percent Fibonacci level, which was also the low of the E and b waves; hence, these waves are no longer E and b. Thus, I have constructed a new wave markup that does not yet account for the ascending wave indicated by a bold red line. I've already stated that the entire wave structure can be complicated indefinitely. This is the drawback of wave analysis, as any structure is always capable of assuming a more complicated and extensive shape.
Consequently, I propose to now focus on simpler wave structures, including waves of a smaller scale. As shown, the creation of an upward wave, which may be wave 4 of a new downward trend section, is proceeding. If this estimate is accurate, the instrument might gain another 100-150 basis points before resuming its slide within wave 5 with objectives below 1.0000. Additionally, the development of the fifth wave may have already begun. So far, I see no reason to anticipate additional instrument moves.The business activity index for the US services sector unexpectedly dropped.
On Friday, at the time of writing, the euro/dollar exchange rate had neither decreased nor climbed. However, the instrument has been decreasing for nearly the entirety of the trading day, and a very robust gain began only a few hours ago that negated the sellers' efforts. Although the dollar's slide began a few hours ago, the major movement happened following the release of business activity indices for several regions of the United States. Consequently, the service sector index fell to 47 points, the composite index to 47.5 points, and the production sector index to 52.3 points. Remember that any figure above 50 is regarded as positive, while any value below 50 is considered negative. Thus, we are already observing an appropriate market response to US numbers.
Indicators of corporate activity in the European Union were also presented today, and they proved to be anything but "optimistic." The service sector index fell to 50.6 points, the manufacturing sector index fell to 49.6 points, and the composite index fell to 49.4 points. Thus, the drop in the value of the European currency during the first part of the trading day has unique causes. And if we consider the entire movement, the instrument merely dropped 100 basis points and then rose by the same amount. Since these moves did not affect the wave pattern, I continue to believe that correction wave 4 has concluded.
Nonetheless, if demand for the euro currency continues to rise, this wave may become more problematic. In this regard, the upcoming week will put a lot into perspective. The Federal Reserve meeting is nearly the most significant event of the month. If demand for the dollar continues to decrease, wave 4 becomes more convoluted, and the entire structure of the most recent segment of the downward trend, since the top of wave 4 may exceed the bottom of wave 1. I anticipate that demand for the US dollar will increase next week.
General conclusions
I infer based on my findings that construction of the downward trend segment continues. If this is the case, it is now viable to sell the instrument with goals at the estimated 0.9397 level, which corresponds to 423.6 percent Fibonacci, for each "down" MACD signal generated during the development of wave 5. Wave 4 is currently completeable.
At the larger wave size, the wave marking of the descending trend segment becomes considerably more complex and extends in length. It can be of virtually any length. Therefore, I believe it's preferable to focus on three and five-wave typical wave shapes for the time being.
 English
 Русский
 Bahasa Indonesia
 Bahasa Malay
 ไทย
ไทย Español
 Deutsch
 Български
 Français
 Tiếng Việt
 中文
中文 বাংলা
বাংলা हिन्दी
 Čeština
 Українська
 Română

