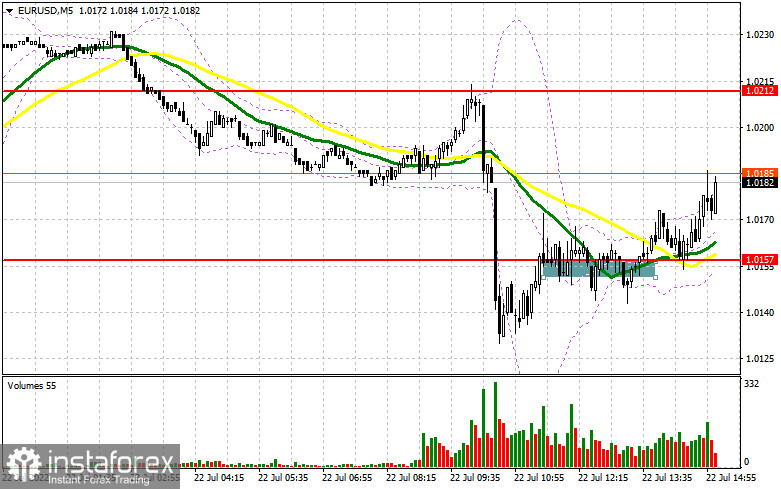
In the morning article, I highlighted the level of 1.0157 and recommended making decisions with this level in focus. Let's take a look at the 5-minute chart and try to figure out what has happened. Weak PMIs for the Eurozone pushed the euro sharply down against the US dollar. EUR/USD broke support at 1.0157. However, the bulls rushed to buy the pair at intraday lows. As a result, EUR/USD rebounded to the previous levels and generated a buy signal. At the moment of writing the article, the price has climbed about 20 pips. The technical picture has changed for the second half of the day.

What is needed to open long positions on EUR/USD
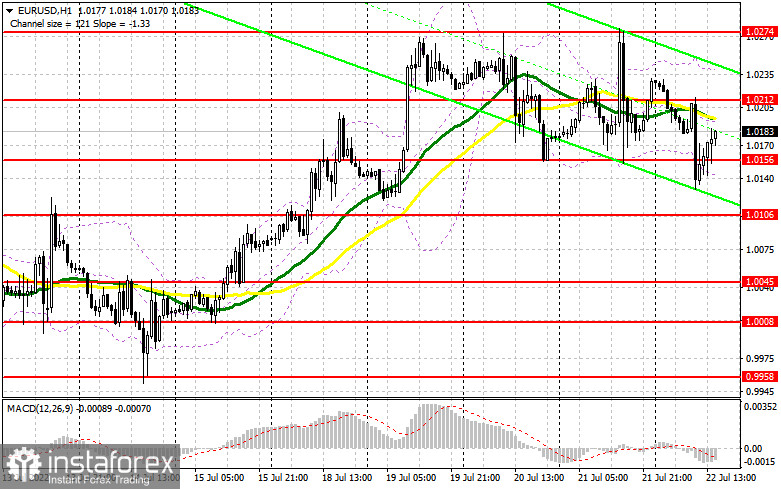
During the New York session, the economic calendar reminds us about important data from the US. The Markit think tank will report the US manufacturing, services PMI, and composite PMI. The crucial data will determine the market trajectory at the end of the week. The data is expected to be strong. Thus, don't be surprised that the euro will come under pressure again following the statistics. To prove their strength, the bulls should act in confidence at around 1.0156, the technical level which came into being in the first half of the day. After a false breakout there, we will predict further growth and the update of the nearest resistance at 1.0212. Further developments will depend on this level. Only a breakout and a test of this level downwards will trigger stop losses of the sellers. The currency pair will generate a signal to enter the market with long positions, reckoning a rebound to the upper border of the range at 1.0247.
A more distant target is seen at 1.0321 where I recommend profit taking. If EUR/USD declinesand the buyers lack activity at 1.0156 in the second half of the day, pressure on the euro will escalate. In this case, I wouldn't recommend you hurry up to enter the market. It would be reasonable to open long positions at a false breakout at around 1.0106. It would be better to buy EUR/USD immediately at a dip from 1.0045 or lower at about 1.0008, bearing in mind an intraday30-35-pips correction.
What is needed to open short positions on EUR/USD
In case EUR/USD makes efforts to grow in the second half of the day following US PMIs, abreakout at 1.0212 will provide an excellent signal to open short positions expecting EUR/USD to decline again to support at 1.0156. A breakout and consolidation below this level and the opposite test upwards will generate another sell signal that will trigger the buyers' stop loss orders. The price will move down to 1.0106 which will affect speculators who want the pair to stay at highs. If the price settles below 1.0106, the door will be open to 1.0045 where I recommend leaving sell positions. A lower target is seen at 1.0008. In case EUR/USD moved up in the American session and the bears lack activity at 1.0212, I would advise you to cancel short positions until more attractive resistance at 1.0274. Only a false breakout there will be the pivot point to sell theeuro. We could open short positions immediately at a bounce off 1.0321 or higher at 1.0374, bearing in mind a 30-35-pips downward correction intraday.

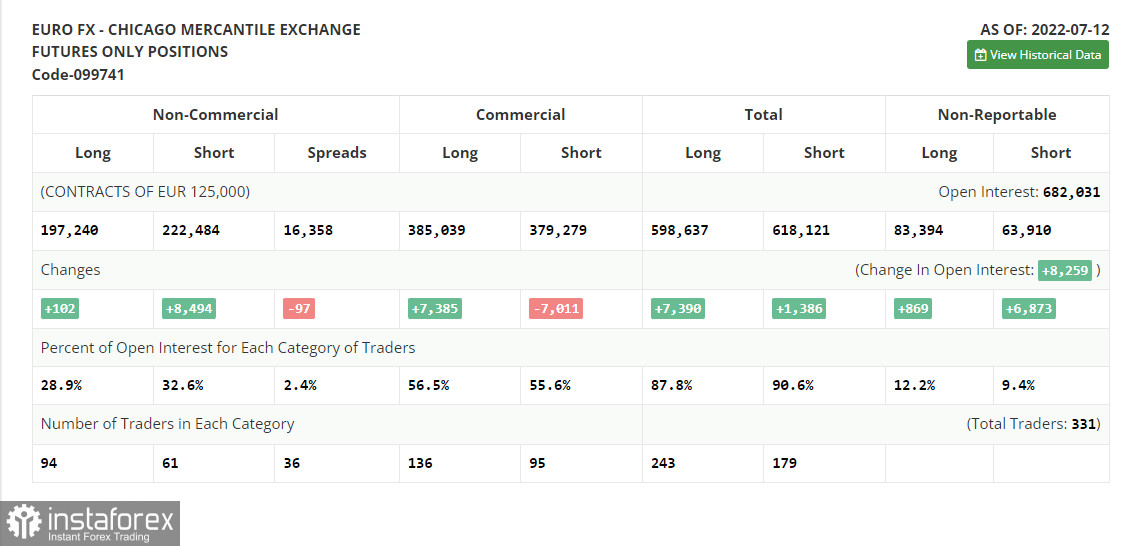
The COT (Commitment of Traders) report from July 12 logs an increase in both long and short positions, but the latter are much more numerous. It indicates that the bearish sentiment is setting the tone. Besides, it caused a larger negative delta because there are few traders willing to buy even at current lows. The reason is upbeat statistics from the US. Inflation acceleration and robust retail sales reinforced the bullish outlook on the US dollar. In turn, traders are reluctant to buy risky assets. As long as the Federal Reserve pursues its hawkish policy, the US dollar is set to assert strength. Traders are alert to a fresh report on inflation in the EU.
The CPI is expected to show another spike in consumer prices. If the forecast comes true, don't be surprised about a moderate upward correction of EUR/USD. However, the euro will hardly avoid another fall and the second test of the parity level. According to the COT report, long non-commercial positions grew just 102 to 197,420 whereas short non-commercial positions jumped by 8,494 to 222,484. Despite the undervalued euro, the hawkish stance of major central banks, and a recession in many developed economies, traders are poised to buy the US dollar. The overall non-commercial net positions remained negative and came in at -25,244 against 016,852. EUR/USD closed lower last Friday at 1.0094 against 1.0316 a week ago.

Indicators' signals:
Trading is carried at around the 30 and 50 daily moving averages. It means that buyers and sellers are in equilibrium.
Moving averages
Note: The period and prices of moving averages are considered by the author on the H1 hourly chart and differ from the general definition of the classic daily moving averages on the daily D1 chart.
Bollinger Bands
If EUR/USD grows, the indicator's upper border at 1.0245 will serve as resistance. A breakout of the indicator's lower border at 1.0156 will escalate pressure on the currency pair.
Description of indicators
Moving average (moving average, determines the current trend by smoothing out volatility and noise). Period 50. It is marked yellow on the chart.
Moving average (moving average, determines the current trend by smoothing out volatility and noise). Period 30. It is marked green on the chart.
MACD indicator (Moving Average Convergence/Divergence — convergence/divergence of moving averages) Quick EMA period 12. Slow EMA period to 26. SMA period 9
Bollinger Bands (Bollinger Bands). Period 20
Non-commercial speculative traders, such as individual traders, hedge funds, and large institutions that use the futures market for speculative purposes and meet certain requirements.
Long non-commercial positions represent the total long open position of non-commercial traders.
Short non-commercial positions represent the total short open position of non-commercial traders.
Total non-commercial net position is the difference between short and long positions of non-commercial traders.
 English
 Русский
 Bahasa Indonesia
 Bahasa Malay
 ไทย
ไทย Español
 Deutsch
 Български
 Français
 Tiếng Việt
 中文
中文 বাংলা
বাংলা हिन्दी
 Čeština
 Українська
 Română

